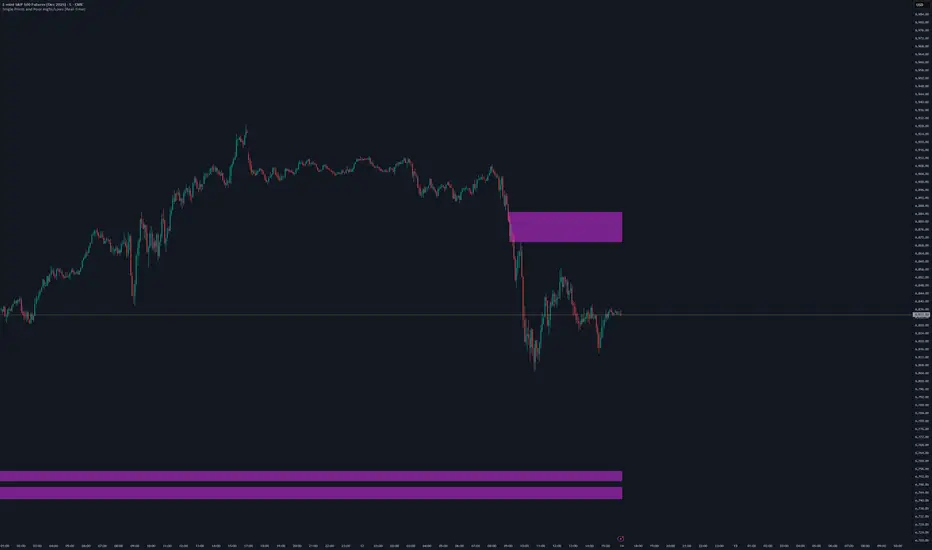
Single Prints and Poor Highs/Lows [Real-Time]This indicator is designed for traders utilizing Auction Market Theory (AMT) who need real-time visibility into market structure inefficiencies. Unlike standard TPO tools that often wait for closed bars or finished sessions, this script builds a developing TPO profile tick-by-tick to identify Single Prints and Poor Highs/Lows the moment they form.
Key Features:
Real-Time Single Prints: Automatically detects and highlights areas of single-print inefficiencies (buying/selling tails) as they happen. These "ghost" boxes persist on the chart until price repairs (fills) them, acting as immediate targets or support/resistance zones.
Poor High/Low Detection: Strictly implements AMT logic to identify "unfinished" auctions. If a session extreme is formed by two or more TPO blocks (indicating a flat top/bottom rather than a rejection tail), it marks the level with a dotted line.
Repair Logic: Both Single Prints and Poor High/Low lines are dynamic. If price revisits and repairs the structure, the markers automatically vanish to keep your chart clean.
Session Control: Fully customizable RTH (Regular Trading Hours) session input (default 08:30–15:15) to ensure profiles are built on relevant liquidity.
Quantization: Adjustable "Ticks per Block" allowing you to tune the sensitivity of the TPO profile to different assets (ES, NQ, CL, etc.).
How It Works:
TPO Construction: The script breaks the session into 30-minute periods (configurable) and tracks price overlap.
Single Prints: When the market expands rapidly, leaving gaps in the profile (single TPO blocks), a box is drawn. If price trades back through this box, it deletes itself.
Poor Extremes: It monitors the current session High and Low. If the extreme price level has a TPO count of ≥ 2, it is flagged as "Poor." If the extreme is a single print (count = 1), it is considered a valid tail and left unmarked.
Settings:
RTH Session: Define your specific trading session time.
TPO Period: Default is 30 minutes (standard AMT).
Ticks per Block: Controls the vertical resolution of the TPO. (Higher values = coarser profile, Lower values = more precision).
Colors: Fully customizable colors for Live Prints, Historical Prints, and Poor High/Low lines.
Usage:
Use this tool to spot immediate structural targets. A Poor High often acts as a magnet for price to revisit and "repair," while Single Prints often defend as support/resistance on the first retest.
在腳本中搜尋"Buy sell"
POWER INDICATOR PREMIUM WITH MANY FUNCTIONS BY OeZkAn
👑 POWER INDICATOR PRO PREMIUM V24: Predictive Intelligence Meets Precision ExecutionThe POWER INDICATOR PRO PREMIUM V24 is the pinnacle of algorithmic trading intelligence. This system transcends traditional indicators by utilizing a sophisticated framework of advanced mathematical equations to predict the impending trend direction before the market moves. It combines Smart Money Concepts (SMC), Multi-Timeframe (MTF) convergence, and Dynamic Risk Management to deliver unparalleled clarity and execution confidence.If you seek a trading partner that provides leading, predictive signals and high-probability entries, this system is your definitive solution.
🧠 The Core Element: Predictive Market Context & Directional ForecastThe foundational strength of the POWER INDICATOR is its ability to forecast the market's bias through advanced quantification:
🚀 Directional Pre-Cognition (LRC & Mathematical Models):The system utilizes the Linear Regression Curve (LRC) and proprietary statistical models as its core mathematical engine. This process extrapolates the probable trend path and generates a Directional Forecast for the coming bars, enabling you to anticipate moves rather than react to them. This forecast serves as the ultimate bias filter.
🧠 The Convictional Filter: Quantifying Probability ($60\%$ Confidence):This filter is our proprietary Probability Brain. It eliminates market noise by forcing convergence across multiple high-level factors (MTF agreement, Momentum, SMC levels).High-Conviction Threshold: Independent analysis confirms that the Conviction Filter provides an exceptionally high win rate and signal quality starting at just $60\%$. Setting your threshold at this level ensures you only consider trades where the predictive mathematical components are in strong alignment.
🌊 FVG & GP Predictive Zones:The system automatically identifies and projects critical Fair Value Gaps (FVG/LSOB) and the Golden Pocket (GP) Re-Test Zone. These zones are algorithmically identified as high-probability targets for pullbacks and reversals, providing a clear map of where liquidity will be sought.
💡 The Convictional Trading Workflow: A 3-Step Guide to ExecutionContext Check: Confirm the LRC Directional Forecast aligns with your trade and the Conviction Score Meter is above your desired threshold (minimum $60\%$).Optimal Entry: Wait for the signal to trigger at a high-R:R entry point (GP, FVG, or Aggressive Impulse), guided by your chosen trading mode.Dynamic Management: Let the system handle risk, utilizing Structural SL and automatic Multi-Method Trailing Stops post-TP1.
🎯 Mode Selection: Matching Strategy to MarketThe indicator's power lies in its Modularity. Selecting the correct mode is crucial for optimizing your results.Trading StyleRecommended ModesPrimary Rationale & Entry LogicHigh-Frequency ScalpingCT Scalp-OnlyDesigned for counter-trend entries in a pullback towards the Golden Pocket (GP). Uses tighter SL/TP multipliers for quick profit-taking. (Fast, high-R:R)ATR Channel Scalp (ACS)Utilizes volatility channels (ATR bands) for quick mean-reversion trades when price overextends.Strategic Day Trading / Swing TradingUltimate Fusion Mode (UFM)The highest probability mode. Best for catching major shifts confirmed by SMC (LRC, GP, FVG, MSS). Waits for a deep, high-R:R Re-Test Entry.Haupttrend & Scalp (Kombi)Excellent general-purpose mode. Focuses on trend continuation but allows for high-R:R pullback entries at key levels (GP/FVG). (Balanced)FVG Mitigation Entry (FME)Ideal for SMC traders. Waits for the price to precisely re-test and mitigate an unmitigated Fair Value Gap (FVG) or Liquidity Sweep (LSOB) zone before entry.Breakout & Momentum TradingBand Breakout-OnlyTriggers an entry only when price decisively breaks outside the SMA Volatility Bands (configurable). Filtered by momentum requirements.Dynamic Range Expansion (DRE)Specifically detects low-volatility consolidation before an anticipated high-momentum expansion phase.
🔔 The Master Alert System: Your Execution EdgeThe powerful Alert functionality ensures you can monitor multiple assets and timeframes without being glued to the screen.1.
✅ Dynamic MASTER ALARM (Compact Text)The core alert uses a compact, dynamic JSON/text message that contains all necessary information for quick execution:Action: BUY / SELLMode Used: Conviction Score: Key Level: 2. LRC/GP Combo-Alert (High-R:R)This is the most valuable alert for strategic traders. It triggers only when the LRC direction is confirmed and the price enters the Golden Pocket (GP) Re-Test Zone, indicating an optimal high-R:R pullback opportunity.Final Note: To maximize the predictive power, ensure the useConvictionFilter is set to a minimum of $60\%$ and the useStructureSL is activated to protect your capital with intelligent stop placement.Stop reacting. Start predicting. Activate the POWER INDICATOR PRO PREMIUM V24 and lead the market today!
⚠️ IMPORTANT NOTICE: Full Version vs. Public Release
This current version, the POWER INDICATOR PRO PREMIUM V24 (Full Feature Test Release), is publicly available only for demonstration and testing purposes to showcase the system's full potential (including all 12 Dynamic Modes and the advanced Convictional Filter).
A slightly streamlined Public Version will remain permanently free and accessible to the community. However, the Full Premium Version—featuring the complete 12-Mode selection, all predictive functionalities, and crucial additions such as enhanced, precise Entry/Exit Labels and Dynamic Stop Loss/Take Profit Labels directly calculated by the algorithm—will soon be available exclusively for subscribers.
Test the power now and be ready for the subscription launch!

Aggressive VS Passive Orders Depletion @MaxMaserati 3.0Aggressive VS Passive Orders Depletion Indicator
Overview
This institutional-grade order flow analysis tool identifies and tracks limit order accumulation zones where significant buy and sell orders are placed in the market. It combines Highest Volume Candle Profile analysis with Market Structure detection to reveal where institutional traders have positioned their orders, and monitors in real-time whether these orders are being absorbed (depleted) or defended.
Core Concept: Order Block Detection & Depletion
This tool tracks the actual limit orders at key price levels and shows you:
Where institutional orders are placed (Buy Order Blocks vs Sell Order Blocks)
How strong these order zones are (original volume strength as %)
Real-time order flow activity (aggressive buyers vs aggressive sellers)
Depletion status (are the orders being consumed or defended?)
How It Works: Dual-Engine System
Engine 1: Volume Profile Analysis - Point of Control (POC) Detection
Divides price range into 25 horizontal levels (configurable)
Analyzes the last 120 bars (configurable lookback)
Distributes volume across price levels based on where each bar traded
Identifies the Point of Control (POC) - the price level with highest traded volume
Determines market bias: Bullish if price above POC, Bearish if below
Purpose: Shows where the majority of volume has been traded, indicating institutional accumulation zones and fair value areas.
Engine 2: Market Structure Analysis (PHL - Pivot High/Low)
Uses fractal pivot detection (configurable strength)
Identifies swing highs and lows that create market structure
Tracks Break of Structure (BOS) - price breaks recent swing in trend direction
Tracks Market Structure Shift (MSS) - price breaks swing points against trend
Maintains a trailing price at the most recent significant swing point
Purpose: Identifies where smart money is likely defending key structural levels with limit orders.
Key Innovation #1: Dynamic Confluence Zone Detection
When the Volume Profile POC and Market Structure trail price align within a configurable sensitivity threshold (default 1.0%), the indicator creates an Order Block Zone.
The Algorithm:
Monitors both engines continuously
Creates zones ONLY when POC is within X% of the structural swing point
Both engines must agree on the significance of the price level
Optional volume confirmation filter
This dual-confirmation approach filters out weak levels and highlights only the highest-probability zones where institutional orders are likely clustered.
Zone Types:
🟢 Buy Order Blocks (Support) - Created when confluence occurs with price above the zone. Represents accumulated buy limit orders waiting to support price.
🔴 Sell Order Blocks (Resistance) - Created when confluence occurs with price below the zone. Represents accumulated sell limit orders waiting to resist price.
Key Innovation #2: Real-Time Aggressive VS Passive Order Flow Analysis
The indicator performs sophisticated order flow decomposition on each candle that interacts with a zone, separating market activity into distinct categories:
Order Flow Categories:
1. Aggressive Orders - Market orders that consume liquidity
Aggressive Buy Volume: Market buys hitting sell limits (taking offers)
Aggressive Sell Volume: Market sells hitting buy limits (hitting bids)
Marked with (AGG) label when detected
Indicates urgent traders willing to pay the spread
2. Passive Orders - Limit orders adding liquidity
Passive Buy Volume: New buy limits being placed (making bids)
Passive Sell Volume: New sell limits being placed (making offers)
Shows patient traders providing liquidity
3. New Order Flow - Fresh buying/selling pressure
New Buyers: Total new buying activity (aggressive + passive)
New Sellers: Total new selling activity (aggressive + passive)
Net pressure indicator for zone health
Key Innovation #3: Advanced Order Flow Decomposition Algorithm
The indicator uses a proprietary candle analysis formula to separate aggressive from passive orders based on two key metrics:
Key Metrics:
Body Strength = |Close - Open| / (High - Low)
Close Position = (Close - Low) / (High - Low)
Bullish Candle Analysis:
Strong Aggressive Buying (Close Position ≥ 0.8 AND Body Strength ≥ 0.7):
90% aggressive buying, 10% passive selling, 90% new buyers
Moderate Aggressive Buying (Close Position ≥ 0.6 AND Body Strength ≥ 0.5):
70% aggressive buying, 20% passive selling, 80% new buyers, 20% new sellers
Weak Bullish (Close Position ≥ 0.5):
0-30% aggressive buying, 20-30% passive selling, 60% new buyers, 40% new sellers
Very Weak Bullish (Close Position < 0.5):
0% aggressive buying, 40% passive selling, 40% new buyers, 60% new sellers
Bearish Candle Analysis:
Strong Aggressive Selling (Close Position ≤ 0.2 AND Body Strength ≥ 0.7):
90% aggressive selling, 10% passive buying, 90% new sellers
Moderate Aggressive Selling (Close Position ≤ 0.4 AND Body Strength ≥ 0.5):
70% aggressive selling, 20% passive buying, 80% new sellers, 20% new buyers
Weak Bearish (Close Position ≤ 0.5):
0-30% aggressive selling, 20-30% passive buying, 60% new sellers, 40% new buyers
Very Weak Bearish (Close Position > 0.5):
0% aggressive selling, 40% passive buying, 40% new sellers, 60% new buyers
What This Reveals:
High close position + strong body = Aggressive buying overwhelming sellers
Low close position + strong body = Aggressive selling overwhelming buyers
Mid-range close = Battle between buyers and sellers
Small body = Passive orders dominating (limit orders being placed, not filled)
Key Innovation #4: Dynamic Depletion System with Intelligent Thresholds
The indicator adapts depletion thresholds based on zone strength:
High Liquidity Zones (>300% volume strength):
Depletion at 40% consumption - Massive clusters considered broken early because partial depletion indicates institutional withdrawal
Medium Liquidity Zones (150-300% volume strength):
Depletion at 60% consumption - Standard institutional behavior, majority must be consumed
Normal Liquidity Zones (75-150% volume strength):
Depletion at 80% consumption - Retail and smaller institutional zones need near-complete absorption
Low Liquidity Zones (<75% volume strength):
Depletion at 100% consumption - Weak zones must be fully absorbed before marked depleted
Why This Matters:
Strong zones failing early = powerful reversal signal (institutions gave up)
Weak zones holding = hidden strength (more orders being added)
Adaptive logic prevents false signals from fixed thresholds
Depletion Formula:
For Buy Order Zones:
Zone Liquidity % = (Original Buy Volume / Average Volume) × 100
Consumed % = (Sell Volume Absorbed / Average Volume) × 100
If Consumed Volume > Dynamic Threshold → Zone DEPLETED
For Sell Order Zones:
Zone Liquidity % = (Original Sell Volume / Average Volume) × 100
Consumed % = (Buy Volume Absorbed / Average Volume) × 100
If Consumed Volume > Dynamic Threshold → Zone DEPLETED
Key Innovation #5: Absorption Detection & Battle Analysis
The indicator identifies when one side is overwhelming the other using a configurable Absorption Threshold (default 1.5x = 50% more volume).
Battle States for Buy Order Blocks:
New Buyers Dominating (New Buyers > New Sellers × 1.5):
Label: ↑ New Buyers: +X% - Buy orders successfully defended
Sellers Attacking (New Sellers > New Buyers × 1.5):
Label: ↓ Sellers Attack: +X% (AGG) - Sell orders overwhelming the zone
Active Battle (Both active, <1.5x ratio):
Label: Battle: B+X% vs S+Y% - Active two-way order flow
Quiet Zone (Minimal activity):
Label: ↔ Quiet: X% - Zone untested or ignored
Battle States for Sell Order Blocks:
New Sellers Dominating (New Sellers > New Buyers × 1.5):
Label: ↓ New Sellers: +X% - Sell orders successfully defended
Buyers Absorbing (New Buyers > New Sellers × 1.5):
Label: ↑ Buyers Absorb: +X% (AGG) - Buy orders overwhelming the zone
Active Battle (Both active, <1.5x ratio):
Label: Battle: S+X% vs B+Y% - Active two-way order flow
Quiet Zone (Minimal activity):
Label: ↔ Quiet: X% - Zone untested or ignored
The (AGG) Marker:
Appears when aggressive market orders are detected (high body strength + extreme close position). Indicates institutional-sized urgency—someone is willing to pay market price NOW. Often precedes breakouts or strong continuations.
Label System Explained
No Label = Untested Zone
When a zone is first created, you see ONLY the colored box with NO label. This means:
Price has NOT yet reached this order block
The limit orders are still pending/resting
The zone is a future area of interest
Labels only appear after first price contact
Label Format (After First Touch):
Line 1: ● XX% Order Type
Line 2: Flow Analysis
Example Labels:
Buy Order Blocks:
● 150% Buy Orders + ↑ New Buyers: +85%
● 150% Buy Orders + ↑ New Buyers: +120% (AGG)
● 150% Buy Orders + Battle: B+45% vs S+38%
● 150% Buy Orders + ↓ Sellers Attack: +95% (AGG)
● 150% Buy Orders + ↓ Sellers Attack: +95% (AGG)
● 150% Buy Orders
Sell Order Blocks:
● 200% Sell Orders + ↓ New Sellers: +110%
● 200% Sell Orders + ↓ New Sellers: +140% (AGG)
● 200% Sell Orders + Battle: S+62% vs B+41%
● 200% Sell Orders + ↑ Buyers Absorb: +88% (AGG)
● 200% Sell Orders + ↑ Buyers Absorb: +88% (AGG)
● 200% Sell Orders
Status Indicators:
- Price penetrated through the zone
- Orders fully consumed, zone exhausted
Gray color - Zone no longer active
Directional Arrows:
↑ - Upward pressure (buyers stronger)
↓ - Downward pressure (sellers stronger)
↔ - Balanced/quiet (low activity)
↗ / ↘ - Mixed battle with bias
Point of Control (POC) Sub-Level Analysis
Each order block contains advanced volume distribution tracking:
Multi-Level Analysis (default 5 levels): Zones subdivided into horizontal price levels
Volume Distribution: Every candle's volume distributed across sub-levels based on price overlap
Buy/Sell Separation: Each level tracks buy vs sell volume independently
Dynamic POC Line: Marks the price level with highest traded volume within the zone
Real-Time Updates: POC adjusts as new volume enters, showing where "fairest price" is migrating
Style Options: Solid, Dashed, or Dotted lines (configurable width 1-5)
POC Trading Significance:
Represents the most accepted price within the order block
Often the best entry price for limit orders (highest liquidity)
POC migration shows whether zone is being "worked higher" or "worked lower"
Breaking through POC often signals zone failure
Key Settings
Volume Profile:
Lookback Period: 120 bars (historical period for POC)
Price Rows: 25 levels (granularity of volume distribution)
Volume Confirmation: Require structure breaks to align with volume bias
Market Structure:
Pivot Strength: 1 (swing detection sensitivity)
Show Trail: Optional trailing price visualization
Confluence Detection:
Sensitivity: 1.0% (distance threshold for POC/Structure alignment)
Lower = Stricter confluence, fewer zones
Higher = More zones detected
Order Flow Analysis:
Show Real-Time Order Flow: Live buyer/seller activity
Show Aggressive Markers: (AGG) labels for market orders
Show Directional Arrows: Price direction indicators (↑↓↔↗↘)
Absorption Threshold: 1.5x (when one side overwhelms the other)
1.5 = 50% more volume needed
2.0 = 100% more (stricter)
1.2 = 20% more (more sensitive)
Visual Options:
Hide Depleted Zones: Auto-remove exhausted blocks
Smart Bar Coloring: Color candles based on signal alignment
Zone Colors: Customize buy/sell colors
Label Text Size: Tiny, Small, Normal, Large
POC Settings:
Show POC Lines: Toggle Point of Control display
POC Analysis Levels: 3-10 levels
Line Width: 1-5 pixels
Line Style: Solid, Dashed, or Dotted
Trading Applications
1. Institutional Order Detection - Identify where large players positioned limit orders using Volume Profile POC + Market Structure confluence
2. Support/Resistance Validation - Dual confirmation filters weak levels, highlights high-probability reversal areas
3. Order Flow Imbalance Trading - Trade in direction of aggressive flow using (AGG) markers, fade zones showing absorption
4. Breakout/Breakdown Confirmation - and statuses validate moves through key levels
5. Liquidity Hunting - Track stop-loss clusters, anticipate stop runs based on depletion patterns
6. Entry Refinement - Use POC lines for precise limit placement at "fairest price" within zones
Combined Signal System
HVN Volume Profile × Market Structure Signals:
STRONG BUY: Both engines bullish + structure break up + volume confirmation
BUY: Bullish bias with partial confirmation
WEAK BUY: Early bullish signals
STRONG SELL: Both engines bearish + structure break down + volume confirmation
SELL: Bearish bias with partial confirmation
WEAK SELL: Early bearish signals
Alert Conditions:
Strong Buy/Sell signals (with volume confirmation)
Confluence zone activation (new order block created)
Order block depletion (zone exhausted)
What Makes This Indicator Unique
Industry-Standard Foundation:
Volume Profile POC detection + Market Structure analysis (swing pivots, BOS/MSS) + Point of Control tracking
Unique Innovations:
Dynamic Confluence Algorithm + Aggressive vs Passive Order Flow Decomposition + Adaptive Depletion Thresholds + Real-Time Absorption Detection + Battle Analysis with (AGG) markers + Complete Unified Methodology
Technical Excellence:
Resource-optimized (max 50 zones), comprehensive safety checks, multi-tier labeling, flexible customization
Best Practices
Wait for first touch - No label = untested zone
Watch (AGG) markers - Institutional urgency signal
Trust adaptive depletion - Strong zones failing early = major reversal
Use POC for entries - Best price within zone
Combine higher timeframes - Daily/4H zones strongest
Respect zones - Failed support becomes resistance
Follow battle labels - Contested areas show stop clusters
Adjust sensitivity - Tight ranges = lower %, trending = higher %
Performance Notes
Maximum Active Zones: 50 (automatic cleanup)
Maximum Lines: 400 (POC managed dynamically)
Lookback Cap: 1000 bars for optimization
Updates: All calculations on bar close for confirmed signals

Volume Comparison with Buyer/Seller PressureTHIS indicator is well-structured and provides a comprehensive way to analyze volume alongside buyer and seller pressure. This indicator helps traders analyze volume dynamics in the stock or cryptocurrency market while simultaneously assessing buyer and seller pressure. Its use case revolves around identifying strong buying or selling activity, neutral conditions, and volume trends over different time periods. Below is a breakdown of how to use this indicator:
This Pine Script indicator helps traders analyze volume dynamics in the stock or cryptocurrency market while simultaneously assessing buyer and seller pressure. Its use case revolves around identifying strong buying or selling activity, neutral conditions, and volume trends over different time periods. Below is a breakdown of how to use this indicator:
Key Features and Use Case
Volume-Based Insights:
Displays daily volume and compares it to the 3-day, 5-day, 10-day, and 20-day moving averages of volume. Helps traders identify days with unusual volume spikes relative to historical averages, signaling potential reversals or breakouts.
Buyer and Seller Pressure:
Measures buyer pressure: how much the closing price dominates the trading range of the day.
Measures seller pressure: how much the opening price dominates the trading range of the day.
Highlights areas where buying or selling pressure is particularly strong (≥ 0.75).
Background Signals:
Green Background: Strong buyer pressure (indicative of potential upward momentum).
Red Background: Strong seller pressure (indicative of potential downward momentum).
Gray Background: Neutral market conditions (neither buying nor selling dominance).
Alerts:
Alerts traders when:
Strong buying signals are detected.
Strong selling signals are detected.
The market is neutral, with neither buyers nor sellers in control.
Decision-Making Aid:
Combines volume analysis with price action (buyer/seller pressure) to help traders identify:
Potential breakout opportunities.
Reversal points.
Neutral zones where a trader might avoid trading due to indecision in the market.
How to Use It in Trading:------->
Add the Indicator:
Apply this Indicator to your Trading View chart to start visualizing the buyer/seller pressure and volume averages.
Interpret Volume Trends:
Look for days when daily volume significantly exceeds the 3-day, 5-day, 10-day, or 20-day average.
These could indicate:
A breakout when aligned with strong buyer pressure.
A sell-off when aligned with strong seller pressure.
React to Background Colors:
* Green Background (Strong Buyer Pressure):
Suggests buyers are dominating the market, and upward momentum is likely.
Use this signal to consider buying opportunities, especially if volume is above average.
* Red Background (Strong Seller Pressure):
Indicates sellers are in control, and prices might fall.
Use this signal to consider selling or shorting opportunities.
* Gray Background (Neutral Market):
Reflects indecision; avoid entering trades during these periods unless other signals support a strategy.
Volume Confirmation:
Combine volume analysis with buyer/seller pressure to confirm trends.
Example: A high daily volume with strong buyer pressure signals a high-probability uptrend.
Set Alerts:
Enable alerts to receive real-time notifications when the market generates strong buy/sell signals or enters a neutral zone.
Who Can Benefit:
* Day Traders: Quickly assess intraday market dynamics and volume trends.
* Swing Traders: Identify breakout opportunities or reversal points based on strong buyer/seller pressure.
* Volume Analysts: Compare historical volume averages to current conditions for deeper insights.
Limitations:
Does not guarantee success—should be combined with other technical indicators or strategies.
In low-volume markets, signals may produce false positives or unreliable results.
Assumes traders have basic knowledge of price action and volume analysis.
By integrating this indicator into your strategy, you gain a powerful tool to analyze buyer/seller dominance alongside volume trends, improving your market timing and trade execution.
The Buyer and Seller Pressure components in this indicator provide crucial insights into the market's sentiment and momentum by analyzing the price action relative to the trading volume. Here's how they are used:
1. Buyer Pressure:
Formula:
Buyer Pressure = (Close − Open) / (High − Low )
Interpretation:
* A high buyer pressure (≥ 0.75) indicates strong bullish sentiment, where the price closes much higher than it opened, and the range (high-low) is sufficiently wide.
* It identifies periods of aggressive buying, often signaling potential bullish trends or confirming upward momentum.
2. Seller Pressure:
Formula:
Seller Pressure = (Close − Open ) / (High -Low )
Interpretation:
*A high seller pressure (≥ 0.75) suggests strong bearish sentiment, where the price closes much lower than it opened, within a wide range.
*It helps identify periods of aggressive selling, signaling potential bearish trends or downward momentum.
Purpose in the Indicator:
1. Market Sentiment Analysis:
* Buyer Pressure and Seller Pressure allow traders to gauge market sentiment—whether buyers or sellers dominate a particular time frame.
* This helps in identifying trend reversals or confirmations.
2. Decision-Making Framework:
* The indicator uses thresholds (default 0.75) to classify the market into:
* Strong Buy Signal: When buyer pressure is dominant.
* Strong Sell Signal: When seller pressure is dominant.
* Neutral Signal: When neither buyer nor seller pressure dominates.
*This classification provides a straightforward decision-making tool for traders.
Risk Management:
*By identifying periods of strong buying or selling, traders can avoid entering trades in highly volatile or one-sided markets, which helps reduce risk.
Volume Confirmation:
*Integrating volume data with buyer/seller pressure helps confirm trends. For example:
*High buyer pressure accompanied by higher-than-average volume strengthens the bullish signal.
*Similarly, high seller pressure with higher-than-average volume confirms bearish signals.
Trade Timing:
*The indicator highlights conditions of potential entry (strong buy) or exit (strong sell), allowing traders to time their trades better based on real-time market activity.
Use Case:
*Example:
*Suppose the indicator shows Buyer Pressure = 0.85 with daily volume above the 3-day average. This combination suggests strong bullish activity with momentum, signaling a buy opportunity.
*Conversely, if Seller Pressure = 0.80 with volume above the 5-day average, it signals strong bearish momentum, ideal for selling or shorting.
This indicator combines buyer/seller pressure with volume dynamics, making it valuable for short-term and intraday traders looking for precise market entries and exits.
The background color in this indicator plays an important visual role in helping traders quickly identify the market sentiment based on buyer and seller pressure. It provides a dynamic, color-coded background that changes depending on the strength of the market's buying or selling activity.
Here's how it works:
Background Color Logic:
1. Green Background (Strong Buy Signal):
*Condition: The background turns green when buyer pressure is greater than or equal to 0.75 (strong buying pressure).
*Interpretation: A green background indicates that there is significant bullish sentiment in the market, with strong buying activity. Traders can interpret this as an environment conducive to buying or holding long positions.
*Visual Effect: This helps to quickly spot bullish market conditions, reinforcing potential entry signals for buyers.
2.Red Background (Strong Sell Signal):
*Condition: The background turns red when seller pressure is greater than or equal to 0.75 (strong selling pressure).
*Interpretation: A red background indicates that the market is dominated by selling, showing strong bearish sentiment. Traders can consider this as a signal to sell or short the asset.
*Visual Effect: The red background highlights moments when the market is heavily selling, prompting traders to either exit long positions or take short positions.
Gray Background (Neutral/Indecision Zone):
Condition: The background turns gray when neither buyer nor seller pressure exceeds 0.75. This means the market is neutral, with no dominant bullish or bearish sentiment.
Interpretation: A gray background suggests market indecision or balance between buyers and sellers. It can indicate periods of consolidation or sideways movement where no strong trend is forming.
Visual Effect: The gray background helps traders avoid entering trades when the market lacks a clear direction or when the sentiment is neutral, reducing risk during indecisive times.
Practical Use:
Instant Visual Confirmation:
*Traders can use the background color as an instant confirmation of the market’s sentiment. For instance, if the background turns green, traders might feel more confident in making a long (buy) trade.
*If the background turns red, it serves as a strong visual cue to short or exit a long position.
Helps with Trade Timing:
*The background color can be used in conjunction with other indicators and volume data to time entries and exits more effectively. For example:
*A green background with strong volume indicates a strong trend that could justify a buy.
*A red background with a significant volume surge signals strong selling pressure, which could prompt a sell.
Simplifies Market Analysis:
*For traders who prefer visual cues over complex analysis, the background color simplifies market conditions. Instead of focusing on individual numbers or values, the color-coded background gives them a quick, intuitive view of the market sentiment.
Summary:
* Green background = Strong buying pressure (bullish sentiment)
* Red background = Strong selling pressure (bearish sentiment)
* Gray background = Neutral market (indecision or balance between buyers and sellers)
This background color functionality helps traders stay aware of the prevailing market sentiment at a glance, providing an intuitive way to guide trading decisions.

Atif's Liquidity Toolkit💎 GENERAL OVERVIEW:
Atif’s Liquidity Toolkit is a price-action-based indicator used to identify Buyside & Sellside Liquidity Levels, Liquidity Sweeps, FVG Sweeps, and Buy/Sell signals, following specific rules from Atif Hussain.
This indicator was developed by Flux Charts in collaboration with Atif Hussain.
🔹Purpose of this indicator:
The purpose of Atif’s Liquidity Toolkit is to help traders understand where liquidity is forming, when it’s being taken, and how momentum shifts immediately afterward. It automates the entire process of identifying buyside & sellside liquidity, detecting liquidity sweeps, and confirming whether displacement followed through a Fair Value Gap. The goal is to give traders a consistent, rule-based framework to interpret market structure.
🎯ATIF’S LIQUIDITY TOOLKIT FEATURES:
Atif’s Liquidity Toolkit indicator includes 6 main features:
Fair Value Gaps
Multi-Timeframe Liquidity Levels
Liquidity Sweeps
Fair Value Gap Sweeps
Buy & Sell Signals with Take-Profit & Stop-Loss Levels
Alerts
1️⃣Fair Value Gaps
🔹What is a Fair Value Gap?:
A Fair Value Gap (FVG) is an area where the market’s perception of fair value suddenly changes. On your chart, it appears as a three-candle pattern: a large candle in the middle, with smaller candles on each side that don’t fully overlap it. A bullish FVG forms when a bullish candle is between two smaller bullish/bearish candles, where the first and third candles’ wicks don’t overlap each other at all. A bearish FVG forms when a bearish candle is between two smaller bullish/bearish candles, where the first and third candles’ wicks don’t overlap each other at all.
Bullish & Bearish FVGs:
In the settings, you can toggle on/off FVGs, choose the invalidation method, adjust the sensitivity, and toggle on FVG Midline & Labels.
🔹Invalidation Method:
The Invalidation Method setting allows traders to choose how an FVG is invalidated. You can choose between Close and Wick.
Close: A candle must close below a bullish FVG or above a bearish FVG to invalidate it.
Wick: A candle’s wick must go below a bullish FVG or above a bearish FVG to invalidate it.
🔹Sensitivity:
The sensitivity setting determines the minimum gap size required for an FVG detection. A higher sensitivity will filter out smaller gaps, while a lower sensitivity will detect more frequent, smaller gaps. Setting the sensitivity to 0 will display all gaps, regardless of their size.
On the left, the sensitivity is 5. On the right, the sensitivity is 0.
🔹Midline:
When enabled, a dashed line is drawn at the center of the FVG.
🔹Labels:
When enabled, a text label will be plotted with the gap, clearly identifying the zone as a FVG.
2️⃣ Multi-Timeframe Liquidity Levels
The indicator automatically detects and plots Buyside Liquidity (BSL) & Sellside Liquidity (SSL) Levels across up to three timeframes simultaneously.
🔹What is Buyside Liquidity?
Buyside Liquidity (BSL) represents price levels where many buy stop orders are sitting, usually from traders holding short positions. When price moves into these areas, those stop-loss orders get triggered and short sellers are forced to buy back their positions. These zones often form above key highs such as the previous day, week, or month. Understanding BSL is important because when price reaches these levels, the sudden wave of buy orders can create sharp reactions or reversals as liquidity is taken from the market.
🔹What is Sellside Liquidity?
Sellside Liquidity (SSL) represents price levels where many sell stop orders are waiting, usually from traders holding long positions. When price drops into these areas, those stop-loss orders are triggered and long traders are forced to sell their positions. These zones often form below key lows such as the previous day, week, or month. Understanding SSL is important because when price reaches these levels, the surge of sell orders can cause sharp reactions or reversals as liquidity is taken from the market.
Atif’s Liquidity Toolkit indicator automatically plots Buyside & Sellside Liquidity levels using the following levels:
Previous Day High (PDH) & Previous Day Low (PDL)
Previous Week High (PWH) & Previous Week Low (PWL)
Previous Month High (PMH) & Previous Month Low (PML)
Asia Session Highs/Lows
London Session Highs/Lows
New York Session Highs/Lows
The session start and end times are not customizable. The following times in EST are used for each session:
Asia Session: 20:00-00:00
London Session: 02:00-05:00
New York Sessions:
NY AM: 09:30-11:00
NY Lunch: 12:00-13:00
NY PM: 14:00-16:00
Users can also plot swing highs/lows using a lookback period and choosing the higher timeframe. Users can choose two custom higher timeframes and also enable swing highs/lows from the current chart’s timeframe.
There are three settings to customize for the current chart’s timeframe and higher timeframes:
Current TF - when toggled on, swing highs/lows will be plotted from the chart’s timeframe using the pivot length input
HTF 1 - when toggled on, swing highs/lows will be plotted from the user-inputted timeframe using the pivot length input
HTF 2 - when toggled on, swing highs/lows will be plotted from the user-inputted timeframe using the pivot length input
The Pivot Length controls how far back the indicator checks to confirm whether a candle’s high or low is a true swing point (also called a “pivot”). When detecting a swing high, the indicator checks if that candle’s high is higher than the highs of the previous X candles and the next X candles. For a swing low, it checks if the candle’s low is lower than the lows of the previous X candles and the next X candles. The number X comes from your Pivot Length setting.
A lower Pivot Length input (for example, 3 or 4) means the indicator only looks at a few candles on each side, so it will detect more swing points, including smaller, less significant ones. A higher Pivot Length input (for example, 20 or 25) makes the indicator look at more candles on each side, so it only marks major turning points that stand out clearly on the chart.
In short:
Low Pivot Length = more frequent, smaller levels (short-term focus)
High Pivot Length = fewer, stronger levels (major swing focus)
The Pivot Length input for each setting (Current TF, HTF 1, and HTF 2) are displayed below in the red boxes:
Each liquidity level is plotted with a text label, making it easy to identify where a level came from. You can turn off the ‘Show Levels’ setting if you don’t want to see the levels on your chart.
Please note: Liquidity Levels play a key role in finding liquidity sweeps, FVG Sweeps, and Buy/Sell signals. Keeping the levels turned off will not stop the indicator from using the levels that are enabled from being used for the other features mentioned.
3️⃣Liquidity Sweeps:
The indicator automatically detects bullish and bearish liquidity sweeps using the liquidity levels you have enabled.
🔹What is a Liquidity Sweep?
A liquidity sweep is a market phenomenon where significant players, such as institutional traders, deliberately drive prices through key levels to trigger clusters of pending buy or sell orders. It’s how the market gathers the liquidity needed for larger participants to enter positions.
Traders often place stop-loss orders around obvious highs and lows, such as the previous day’s, week’s, or month’s levels. When price pushes through one of these areas, it triggers the stops placed there and generates a burst of volume. This often creates a short-term fake-out before the market reverses in the opposite direction.
By detecting these sweeps in real time, traders can identify potential reversal areas or “trap” areas where liquidity has been taken.
🔹Bullish Liquidity Sweep
These occur when price dips below a Sellside Liquidity (SSL) level, taking out the stop-loss orders placed by long traders below that low. The indicator marks a zone around the candle that swept the SSL to highlight where liquidity was removed from the market.
When this happens, it shows that the market just cleared out sell-side liquidity, meaning traders who were long had their stops hit. This is often followed by a reversal or strong reaction upward, because the market no longer has pending liquidity to fill below that level.
🔹Bearish Liquidity Sweep
These occur when price dips above a Buyside Liquidity (BSL) level, taking out the stop-loss orders placed by short seller traders above that high. The indicator marks a zone around the candle that swept the BSL to highlight where liquidity was removed from the market.
When this happens, it shows that the market just cleared out buyside liquidity, meaning short traders had their stops hit. This is often followed by a reversal or strong reaction downward, because the market no longer has pending liquidity to fill above that level.
Under the ‘Liquidity Sweeps’ section in the settings, you can toggle on/off Bullish Regular Sweeps and Bearish Regular Sweeps. You can also customize the line style and color of liquidity levels that have been swept.
🔹How to Use Liquidity Sweeps
Liquidity sweeps are not direct trade signals. They are best used as context when forming a directional bias. A sweep shows that the market has removed liquidity from one side, which can hint at where the next move may develop.
For example:
When Buyside Liquidity (BSL) is swept, it often signals that buy stops have been triggered and the market may be preparing to move lower. Traders may then begin looking for short opportunities.
When Sellside Liquidity (SSL) is swept, it often signals that sell stops have been triggered and the market may be preparing to move higher. Traders may then begin looking for long opportunities.
It’s common practice to use liquidity sweeps as the first step in building a trade idea. Many traders will wait for additional confirmation, such as a fair value gap forming after the sweep, before opening a position.
Under the ‘Liquidity Sweeps’ section in the settings, you can toggle on/off:
Bullish Regular Sweeps - when disabled, Bullish Regular Sweeps won’t appear on your chart.
Bearish Regular Sweeps - when disabled, Bearish Regular Sweeps won’t appear on your chart.
4️⃣Fair Value Gap Sweeps:
The indicator automatically detects bullish and bearish Fair Value Gap sweeps (FVG Sweep) using the liquidity levels you have enabled.
🔹What is a FVG Sweep?
A FVG Sweep is a specific type of liquidity sweep that not only clears liquidity above or below a key level, but also forms a Fair Value Gap (FVG) immediately afterward.
The liquidity sweep shows where stop orders were triggered, areas where the market aggressively took out one side’s liquidity. The formation of a Fair Value Gap right after the sweep confirms that displacement followed. This means that the sweep was not just a stop hunt, but a deliberate move backed by momentum.
In simple terms, a regular liquidity sweep only tells you that liquidity was taken. A FVG Sweep tells you that liquidity was taken and a strong directional move started immediately after, leaving an imbalance in price. That imbalance represents where aggressive buyers or sellers entered the market without enough opposite-side orders to keep price balanced. This combination adds a confirmation and intent behind regular liquidity sweeps.
🔹Bullish FVG Sweep
The indicator automatically detects bullish FVG Sweeps when price takes out a Sellside Liquidity (SSL) level and then forms a bullish FVG within the next few candles. This sequence shows that sellers were stopped out and buyers immediately entered the market with momentum.
🔹Bearish FVG Sweep
The indicator automatically detects bearish FVG Sweeps when price takes out a Buyside Liquidity (BSL) level and then forms a bearish FVG shortly after. This shows that short sellers’ stops were triggered, and new selling pressure entered the market right away.
🔹How to Use FVG Sweeps
Unlike regular liquidity sweeps, FVG Sweeps can be used as trade entries because they confirm both liquidity being cleared and immediate momentum. A regular sweep only shows that stop-losses were triggered, but an FVG Sweep proves that price not only cleared liquidity but also moved away with momentum, leaving behind an imbalance (Fair Value Gap). This shift often marks the start of a new short-term trend.
We’ll cover this in more detail in the Buy and Sell Signal section below, but in short, a bullish FVG Sweep can act as confirmation for a potential long entry after price takes out a low, while a bearish FVG Sweep can confirm a short entry after price takes out a high.
The strongest FVG Sweeps come from extremely sharp reversals. On the chart, they look like a “V” shape for bullish setups or an inverted “V” shape for bearish setups. This shape shows how quickly momentum shifted after liquidity was cleared. When price instantly reverses and leaves a Fair Value Gap behind, it’s a clear sign that buyers or sellers stepped in aggressively and absorbed all available liquidity on the opposite side.
In practice, traders often use FVG Sweeps as a trigger to align their bias. For example, after a bullish FVG Sweep, the focus shifts toward looking for long setups within the new imbalance or during a small retracement into the Fair Value Gap. After a bearish FVG Sweep, traders focus on short setups as price retraces back into the gap before continuing lower. The key takeaway is that FVG Sweeps show conviction.
Under the ‘Liquidity Sweeps’ section in the settings, you can toggle on/off:
Bullish FVG Sweeps - when disabled, Bullish FVG Sweeps won’t appear on your chart.
Bearish FVG Sweeps - when disabled, Bearish FVG Sweeps won’t appear on your chart.
Please Note: the settings you choose to use for Fair Value Gaps, under the ‘Fair Value Gaps’ section, will be used for FVG Sweeps. This is important because if you increase the sensitivity value for FVGs, not all FVG Sweeps will appear if the FVG’s size doesn’t meet the sensitivity threshold.
5️⃣Buy & Sell Signals:
This indicator also plots Buy & Sell signals. These signals follow logic based on Atif Hussain’s FVG trading model. The entry requirements for a Long & Short signal are outlined below.
🔹Buy Signal:
In order for a Buy Signal to generate, the following conditions must occur in order:
Bullish FVG Sweep
Price Retraces to the Bullish FVG
🔹Sell Signal:
In order for a Buy Signal to generate, the following conditions must occur in order:
Bearish FVG Sweep
Price Retraces to the FVG
🔹Require Retracement:
Under the ‘Signals’ section in the settings, you can toggle on/off the ‘Require Retracement’ setting. When disabled, a long/short signal will appear immediately after a Bullish or Bearish FVG Sweep, instead of waiting for price to retrace back to the gap.
Please Note: the liquidity levels you enable under the ‘Liquidity Levels’ section will be the levels used for signals. Thus, if you only have the Previous Day Highs/Lows enabled, then only those levels will be used to generate buy/sell signals. Also, long Signals will only appear if Bullish FVG Sweeps are enabled, and Short Signals will only appear if Bearish FVG Sweeps are enabled.
When a Buy Signal or Sell Signal is plotted, three suggested take-profit levels and one suggested stop-loss level are plotted. There are two different Take-Profit methods you can choose from within the indicator settings: Manual or Auto.
🔹Manual Take-Profit:
If you’re using manual take-profit levels, you can customize the Risk-to-Reward (RR) for Take-Profit 1, 2, and 3 by adjusting the “RR 1”, “RR 2”, and “RR 3” settings. Setting RR 1 to 1 means take-profit 1 is a 1:1 risk-to-reward ratio. The stop-loss will always be placed at the recent low for Buy Signals, and at the recent high for Sell Signals.
🔹Auto Take-Profit:
If you select to use Auto Take-Profit instead of Manual, then Take-Profit 1, 2, and 3 will be automatically determined based on nearby liquidity levels. The stop-loss will be placed at the recent low for Buy Signals, and at the recent high for Sell Signals. Take-Profit Levels 1, 2, and 3 will be placed at the three closest opposite liquidity levels. If the take-profit 2 and take-profit 3 levels are too far away, only one take-profit level will be displayed.
🔹Signal Settings:
Long Signals:
When enabled, long signals are shown. When disabled, long signals will not appear.
Short Signals:
When enabled, short signals are shown. When disabled, short signals will not appear.
Require Retracement:
When enabled, price must retrace to a FVG after a FVG Sweep in order for a signal to be generated.
Take-Profit Levels:
When enabled, take-profit levels (TP 1, TP 2, and TP 3) are shown with long/short signals. When disabled, take-profit levels and their price labels are not displayed.
Take-Profit Labels:
When enabled, take-profit labels are displayed when price reaches one of the three take-profit levels. When disabled, labels won’t appear when price reaches take-profit levels.
Stop-Loss Levels:
When enabled, stop-loss levels are shown for long/short signals. When disabled, the stop-loss level and its price label are not displayed.
Stop-Loss Labels:
When enabled, stop-loss levels are shown for long/short signals. When disabled, a label won’t appear when price reaches the stop-loss level.
6️⃣Alerts:
The indicator supports alerts, so you never miss a key market move. You can choose to receive alerts for each of the following conditions:
Bearish Liquidity Sweep
Bullish Liquidity Sweep
Bearish FVG Sweep
Bullish FVG Sweep
Long Signal
Short Signal
TP 1
TP 2
TP 3
Stop-Loss
‼️Important Notes:
TradingView has limitations when running features on multiple timeframes, such as the liquidity levels, which can result in the following error:
🔹Computation Error:
The computation of using MTF features are very intensive on TradingView. This can sometimes cause calculation timeouts. When this occurs, simply force the recalculation by modifying one indicator’s settings or by removing the indicator and adding it to your chart again.
🚩 UNIQUENESS:
This indicator is unique because it identifies a specific type of liquidity event referred to as FVG Sweeps, where price takes liquidity and then immediately forms a Fair Value Gap in the opposite direction. These FVG Sweeps serve as the foundation of the model, and the script uses them as the required condition for generating Buy and Sell signals. Once an FVG Sweep is confirmed, the indicator automatically produces a fully defined trade idea with a stop-loss and up to three take-profit targets, following a consistent rule-based execution approach.

TradingIQ - OrderFlow IQIntroducing “OrderFlow IQ”
OrderFlow IQ is an all-in-one order-flow and volume-profiling suite crafted to bring true market microstructure to your TradingView charts. It bundles footprints, per-bar and intra-bar delta analytics, class-based delta tracking, adaptive volume profiles, bubble-style trade tapes, live time-and-sales feeds, cumulative-volume fight meters, iceberg detection, and more—all driven by a single, user-friendly interface.
Features
The list below details an ever=expanding list of the indicators capabilities; more to come in the future!
Tick-based Footprints
Imbalance and stacked imbalance detection
Tick-based chronicled volume profile
Delta classification (small order, medium order, and block order delta)
Tick-based order flow bubble tape
Live order feed with total buying volume against total selling volume
Tick-based CVD
Iceberg order detection
Delta class lines
Tick-based bar statistics
Key Components and Their Functions
Data Granularity
• 1-Tick / 1-Second / 1-Minute modes let you choose the resolution of every calculation. On true tick charts you get genuine tick-by-tick precision; on second charts you see every intra-second print; on anything else it falls back to minute bars.
Footprint Engine
Bid vs Ask Volume Columns – Each candle is sliced into tick-level price rows showing buy-volume, sell-volume, total volume, delta and delta%.
CVD-Level Columns – Optionally color each row by net cumulative delta instead of raw volume to spotlight buying or selling pressure trends.
Imbalance Detection – Highlight rows where one side exceeds your % threshold, with “stacked” imbalances calling out multi-row alignment ahead of potential breaks.
Value Area & POC – Automatically compute and draw the 70% value area (VAH/VAL) and mark the Point of Control per session or any chosen timeframe.
Footprint
The image above shows the volume profiling data calculated for each row across the footprint engine.
Delta: Shows the net difference between buying and selling
Delta Percentage: Calculates delta as a percentage of total volume
Total Volume: The total volume at the price block
Buy Volume: The total buying volume at the price block
Sell Volume: The total selling volume at the price block
Additionally, you can select to only show buying volume and selling volume at each price block, as shown in the image above.
POC
The image above shows the visuals used to mark the POC of the footprint. The POC is marked yellow by default; the color can be changed in the settings.
Value Area
The image above shows the visuals used to mark the value area of the footprint.
Imbalance Detection
The image above shows the Footprint Engine detecting and marking buying/selling imbalances.
Stacked Imbalances
The image above shows the Footprint Engine detecting and marking stacked imbalances. Stacked imbalances are shown as consecutive, small blocks to the right of the footprint.
CVD Levels
The image above shows the footprint engine calculating CVD across the footprint, rather than net delta that resets bar by bar. Traders can enable the "Use CVD Levels" setting to have net delta persist across price bars, allowing traders to see the net CVD across various price blocks as the footprint develops.
Delta Class Statistics
With the inclusion of tick volume, The Delta Class Statistics component of the indicator classifies volume delta by order size to give traders detailed insights into whether small players are buying/selling and whether big players are buying/selling.
The image above shows a full view of the Delta Class Statistics feature.
The image above further explains the Delta Class Statistics view.
Orders are distributed (classified) across various order size amounts. From here, a rolling CVD is calculated across each order size. This feature gives traders detailed insights into whether big money is buying/selling (big player sentiment) and whether small money is buying/selling (small player sentiment).
Analysis
The image above shows a net-negative CVD for the session for both small orders (small money) and big orders (big money), while "medium" sized orders are currently at a net-positive CVD.
Consequently, sentiment for big players is bearish.
Additionally, small triangles are printed alongside each Delta Class box for each bar. You can hover over these labels with your cursor to see the net delta for the bar for each order size.
Bar Delta Statistics
With the inclusion of tick data, OrderFlow IQ is designed to generate detailed tick-based bar statistics for each candlestick.
The image above shows the feature in action.
Metrics
Volume: Total volume for the bar
Bar VWAP: The individual bar's VWAP
Delta: Net delta for the bar
Delta %: Delta % of the bar
Max Delta: The maximum positive delta achieved during the bar
Min Delta: The lowest negative delta achieved during the bar
CVD: Cumulative volume delta measurement by the bar
Buy Volume: Total buying volume for the bar
Sell Volume: Total selling volume for the bar
Iceberg Detection (Tick-Data Only)
An Iceberg Order is a type of large trading order that is broken up into much smaller visible portions. Only a small part of the order is displayed in the public order book at any given time, while the rest is hidden (like an iceberg where only the tip is above water).
Why are Iceberg Orders Important?
Minimizing Market Impact
If a trader were to post a 10,000-share sell order openly, the market would immediately react:
Buyers might panic, thinking there's a rush to sell.
Sellers could undercut the price aggressively.
This would likely drive the price down before the large order even finishes executing.
By revealing only a small portion at a time, Iceberg orders help avoid spooking the market and allow the trader to sell closer to the original price.
Hiding Trading Intentions
Markets are highly sensitive to order flow — the balance of buying and selling pressure.
If competitors, market makers, or algorithmic traders see a massive order, they might:
Front-run it (selling before it completes to profit from the expected price drop).
Reassess their own models about supply/demand imbalances.
Iceberg orders protect against this by masking true supply or demand.
Our Iceberg Detection Model
Using a proprietary iceberg order detection algorithm, OrderFlow IQ is capable of detecting/alerting iceberg orders when they occur.
The image above shows the Iceberg Detector in action.
When an iceberg order is identified, the size of the order in the quote currency, price of execution, and number of executions will be displayed.
It's important to set alerts for this feature, as iceberg orders aren't frequent and are easy to miss when away from the chart.
IQ Volume Profile (Chronicled Volume Profile)
OrderFlow IQ generates a Chronicled Volume Profile to give traders detailed insights into net delta by price level, but also historical net delta by price level.
The image above shows the feature in action. While the chronicled volume profile is seemingly a normal volume profile, the narrow-lines across the chronicle profile show historical min/max delta at each price level.
The image above exemplifies the feature.
The wide price blocks show the current net delta at each price area, while the small lines (with a circle at the end) show historical min/max delta at the price level.
This tool allows traders to see if buying/selling always dominated a price level, or if control of the price level changed hands between buyers/sellers throughout development of the profile.
Additionally, traders can hover over the small circles on the profile with their cursor to see the detailed delta statistics at each price area. The statistics will show the minimum delta at the price area, maximum delta, and the live change in delta.
Order Feed
OrderFlow IQ is capable of generating a live order feed with various metrics to assist real time orderflow traders in their analysis.
The image above exemplifies the feature.
Bid/Ask: The bid price and ask price of the current bar
Buys | Price: The size of a buy order and price of execution
Sells | Price: The size of a sell order and price of execution
▴ Vol: Cumulative buying volume (in quote currency) for the feed
▾ Vol: Cumulative selling volume (in quote currency) for the feed
Speed of tape: The average speed between each order fill
OrderFlow Bubble Tape
OrderFlow IQ also displays a traditional orderflow indicator, also known as OrderFlow Bubble Tape.
The image above shows the feature in action.
Orderflow Bubble Tape is a visual tool that shows recent market trades ("tape") as bubbles, where each bubble represents a trade.
The size of each bubble indicates the trade size (volume), and the color shows whether the trade was a buy (aggressive at the ask) or sell (aggressive at the bid).
Instead of showing trades as plain text (like a traditional tape), the bubble format makes it easier to spot bursts of aggressive buying or selling visually.
Clusters of large, fast bubbles in one color suggest momentum or imbalances in order flow, often signaling short-term price pressure.
Traders use Bubble Tape to quickly read supply/demand dynamics, identify hidden buyers/sellers (like iceberg orders), and anticipate short-term price moves.
Blue Bubble = Buy
Red Bubble = Sell
The larger the bubble, the larger the order. Traders can hover over each bubble with their cursor to see the exact size of the order.
Delta Class Lines
OrderFlow IQ shows Live Delta Class Lines grouped by order size buckets:
The blue line shows delta coming only from very large orders (100K–10B in size).
The red line shows delta coming from medium-large orders (50K–100K size).
The green line shows delta from small to medium orders (0–50K size).
Each line is the cumulative net delta for its class — meaning it is adding the buy and sell imbalances only from trades of that size class, live as trades occur.
For example, when a 30K-sized aggressive buy hits, it adds to the green line; if a 70K-sized sell hits, it subtracts from the red line.
The number next to each label is the current net delta value for that class, telling you whether buyers or sellers are dominating at that order size.
• Three Custom Dollar Brackets – Define “small,” “mid,” and “block” trade-size ranges (e.g., 0–50 K, 50 K–100 K, > 100 K).
• Live Streaming Lines – While a bar is forming, watch real-time totals for each bracket plotted as vertical columns or stair-step lines on the chart edge.
CVD
OrderFlow IQ also displays CVD as either candles or a line.
The image above shows the candles visualization for CVD. CVD can be calculated using tick data, 1-second bars, or 1-minute bars. The higher the granularity the more accurate the measurement.
More Features To Come
New features and calculations will be added to OrderFlow IQ based on community feedback, so feel free to share any requests you might have!
Summary
OrderFlow IQ brings a full suite of order-flow analytics into one Pine Script: footprints, delta analytics, dollar-bracket classes, adaptive profiles, bubble tapes, live feeds, CVD meters, and iceberg scans. Its unified Data Granularity switch and Preset System let you toggle entire dashboards with a click—scalpers, intraday traders, and long-term analysts alike can dial in the exact microstructure view they need without switching scripts. Publish once, share your preset layouts, and your TradingView community gains plug-and-play access to professional-grade order-flow tools—no extra installations or feeds required.
付費腳本

Kinetic EMA & Volume with State EngineKinetic EMA & Volume with State Engine (EMVOL)
1. Introduction & Concept
The EMVOL indicator converts a dense family of EMA signals and volume flows into a compact “state engine”. Instead of looking at individual EMA lines or simple crossovers, the script treats each EMA as part of a kinetic vector field and classifies the market into interpretable states:
- Trend direction and strength (from a grid of prime‑period EMAs).
- Volume regime (expansion, contraction, climax, dry‑up).
- Order‑flow bias via delta (buy versus sell volume).
- A combined scenario label that summarises how these three layers interact.
The goal is educational: to help traders see that moving averages and volume become more meaningful when observed as a structure, not as isolated lines. EMVOL is therefore designed as a real‑time teaching tool, not as an automatic signal generator.
2. Volume Settings
Group: “Volume Settings”
A. Calculation Method
- Geometry (Source File) – Default mode.
Buy and sell volume are estimated from each candle’s geometry: the close is compared to the high/low range and the bar’s total volume is split proportionally between buyers and sellers. This approximation works on any TradingView plan and does not require lower‑timeframe data.
- Intrabar (Precise) – Reconstructs buy/sell volume using a lower timeframe via requestUpAndDownVolume(). The script asks TradingView for historical intrabar data (e.g., 15‑second bars) and builds buy/sell volume and delta from that stream. This mode can produce a more accurate view of order flow, but coverage is limited by your account’s history limits and the symbol’s available lower‑timeframe data.
B. Intrabar Resolution (If Precise)
- Intrabar Resolution (If Precise) – Selected only when the calculation method is “Intrabar (Precise)”. It defines which lower timeframe (for example 15S, 30S, 1m) is used to compute up/down volume. Smaller intrabar timeframes may give smoother and more granular deltas, but require more historical depth from the platform.
When “Intrabar (Precise)” is active, the dashboard’s extended section shows the resolution and the number of bars for which precise volume has been successfully retrieved, in the format:
- Mode: Intrabar (15S) – where N is the count of bars with valid high‑resolution volume data.
In Geometry mode this counter simply reflects the processed bars in the current session.
3. Kinetic Vector Settings
Group: “Kinetic Vector”
A. Vector Window
- Vector Window – Controls the temporal smoothing applied to the aggregated vectors (trend, volume, delta, etc.). Internally, each bar’s vector value is averaged with a simple moving window of this length.
- Shorter windows make the state engine more reactive and sensitive to local swings.
- Longer windows make the states more stable and better suited to higher‑timeframe structure.
B. Max Prime Period
- Max Prime Period – Sets the largest prime number used in the EMA grid. The engine builds a family of EMAs on prime lengths (2, 3, 5, 7, …) up to this limit and converts their slopes into angles.
- A higher limit increases the number of long‑horizon EMAs in the grid and makes the vectors sensitive to broader structure.
- A lower limit focuses the analysis on short- and medium‑term behaviour.
C. Price Source
- Price Source – The price series from which the kinetic EMA grid is built (e.g., Close, HLC3, OHLC4). Changing the source modifies the context that the state engine is reading but does not change the core logic.
4. State Engine Settings
Group: “State Engine Settings”
These inputs define how the continuous vectors are translated into discrete states.
A. Trend Thresholds
- Strong Trend Threshold – Value above which the trend vector is treated as “extreme bullish” and below which it is “extreme bearish”.
- Weak Trend Threshold – Inner boundary between neutral and directional conditions.
Roughly:
- |trend| < weak → Neutral trend state.
- weak < |trend| ≤ strong → Bullish/Bearish.
- |trend| > strong → Extreme Bullish/Extreme Bearish.
B. Volume Thresholds
- Volume Climax Threshold – Upper bound at which volume is considered “climax” (unusually expanded participation).
- Volume Expansion Threshold – Boundary for normal expansion versus contraction.
Conceptually:
- Volume above “expansion” indicates increasing activity.
- Volume near or above “climax” marks extreme participation.
- Negative values below the symmetric thresholds map to contraction and extreme dry‑up (liquidity vacuum) states.
C. Delta Thresholds
- Strong Delta Threshold – Cut‑off for extreme buying or selling dominance in delta.
- Weak Delta Threshold – Threshold for mild buy/sell bias versus neutral order flow.
Combined with the sign of the delta vector, these thresholds classify order flow as:
- Extreme Buy, Buy‑Dominant, Neutral, Sell‑Dominant, Extreme Sell.
D. State Hysteresis Bars
- State Hysteresis Bars – Minimum number of bars for which a new state must persist before the engine commits to the change. This prevents the dashboard from flickering during fast spikes and emphasises persistent market behaviour.
- Smaller values switch states quickly; larger values demand more confirmation.
5. Visual Interface
Group: “Visual Interface”
A. Ribbon Base Color
- Ribbon Base Color – Base hue for the multi‑layer EMA ribbon drawn around price. The script plots a dense grid of hidden EMAs and fills the gaps between them to form a semi‑transparent band. Narrow, overlapping bands hint at compression; wider separation hints at dispersion across EMA horizons.
B. Show Dashboard
- Show Dashboard – Toggles the on‑chart table which summarises the current state engine output. Disable this if you only want to keep the EMA ribbon and volume‑based structure on the price chart.
C. Color Theme
- Color Theme – Switch between a dark and light style for the dashboard background and text colours so that the table matches your chart theme.
D. Table Position
- Table Position – Places the dashboard at any corner or edge of the chart (Top / Middle / Bottom × Left / Centre / Right).
E. Table Size
- Table Size – Changes the dashboard’s text size (Tiny, Small, Normal, Large). Use a larger size on high‑resolution screens or when streaming.
F. Show Extended Info
- Show Extended Info – Adds diagnostic rows under the main state summary:
- Mode / Primes / Vector – Shows the current calculation mode (Geometry / Intrabar), the selected intrabar resolution and coverage in bars ( ), how many prime periods are active, and the vector window.
- Values – Displays the current aggregated vectors:
- P: price vector
- V: volume vector
- B: buy‑volume vector
- S: sell‑volume vector
- D: delta vector
Values are bounded between ‑1 and +1.
- Volume Stats – Prints the last bar’s raw buy volume, sell volume and delta as formatted numbers.
- Footer – A final row with the symbol and current time: #SYMBOL | HH:MM.
These extended rows are meant for inspecting how the engine is behaving under the hood while you scroll the chart and compare different assets or timeframes.
6. Language Settings
Group: “Language Settings”
- Select Language – Switches the entire dashboard between English and Turkish.
The underlying calculations and scenario logic are identical; only the labels, titles and comments in the table are translated.
7. Dashboard Structure & Reading Guide
The table summarises the current situation in a few rows:
1. System Header – Shows the script name and the active calculation method (“Geometry” or “Intrabar”).
2. Scenario Title – High‑level description of the current combined scenario (e.g., “Trending Buy Confirmed”, “Sideways Balanced”, “Bull Trap”, “Blow‑Off Top”). The background colour is derived from the scenario family (trending, compression, exhaustion, anomaly, etc.).
3. Bias / Trend Line – States the dominant trend bias derived from the trend vector (Extreme Bullish, Bullish, Neutral, Bearish, Extreme Bearish).
4. Signal / Consideration Line – A short sentence giving qualitative guidance about the current state (for example: continuation risk, exhaustion risk, trap‑like behaviour, or compression). This is deliberately phrased as a consideration, not as a direct trading signal.
5. Trend / Volume / Delta Rows – Three separate rows explain, in plain language, how the trend, volume regime and delta are classified at this bar.
6. Extended Info (optional) – Mode / primes / vector settings, current vector values, and last‑bar volume statistics, as described above.
Together, these rows are meant to be read as a narrative of what price, volume and order‑flow are doing, not as mechanical instructions.
8. State Taxonomy
The state engine organizes market behaviour in three stages.
8.1 Trend States (from the Price Vector)
- Extreme Bullish Trend – The prime‑grid price vector is strongly upward; most EMAs are aligned to the upside.
- Bullish Trend – Upward bias is present, but less extreme.
- Neutral Trend – EMAs are mixed or flat; price is effectively sideways relative to the grid.
- Bearish Trend – Downward bias, with the EMA grid sloping down.
- Extreme Bearish Trend – Strong downside alignment across the grid.
8.2 Volume Regime States (from the Volume Vector)
- Volume Climax (Buy‑Side) – Strong positive volume vector; participation is unusually high in the current direction.
- Volume Expansion – Activity above normal but below the climax threshold.
- Neutral Volume – No major expansion or contraction versus recent history.
- Volume Contraction – Activity is drying up compared with the past.
- Extreme Dry‑Up / Liquidity Vacuum – Very low participation; the market is thin and prone to slippage.
8.3 Delta Behaviour States (from the Delta Vector)
- Extreme Buy Delta – Buying pressure dominates strongly.
- Buy‑Dominant Delta – Buy volume exceeds sell volume, but not at an extreme.
- Neutral Delta – Buy and sell flows are roughly balanced.
- Sell‑Dominant Delta – Selling pressure dominates.
- Extreme Sell Delta – Aggressive, one‑sided selling.
8.4 Combined Scenario State s
EMVOL uses the three base states above to generate a single scenario label. These scenarios are designed to be read as context, not as entry or exit signals.
Trending Scenarios
1. Trending Buy Confirmed
- Bullish or extreme bullish trend, supported by expanding or climax volume and buy‑side delta.
- Educational idea: a healthy uptrend where both participation and order flow agree with the direction.
2. Trending Buy – Weak Volume
- Bullish trend, but volume is neutral, contracting or in dry‑up while delta is still buy‑side.
- Educational idea: price is advancing, yet participation is thinning; trend continuation becomes more fragile.
3. Trending Sell Confirmed
- Bearish or extreme bearish trend, with expanding or climax volume and sell‑side delta.
- Educational idea: strong downtrend with both volume and order‑flow confirmation.
4. Trending Sell – Weak Volume
- Bearish trend, but volume is neutral, contracting or very low while delta remains sell‑side.
- Educational idea: downside continues but with limited participation; vulnerable to short‑covering.
Sideways / Range Scenarios
5. Sideways Balanced
- Neutral trend, neutral delta, neutral volume.
- Classic range environment; low directional edge, suitable for observation and context rather than trend trading.
6. Sideways with Buy Pressure
- Neutral trend, but buy‑side delta is dominant or extreme.
- Range with latent accumulation: price may still appear sideways, but buyers are quietly more active.
7. Sideways with Sell Pressure
- Neutral trend with dominant or extreme sell‑side delta.
- Distribution‑like environment where price chops while sellers are gradually more aggressive.
Exhaustion & Volume Extremes
8. Exhaustion – Buy Risk
- Extreme bullish trend, volume climax and strong buy‑side delta.
- Educational idea: very strong up‑move where both participation and delta are already stretched; risk of exhaustion or blow‑off.
9. Exhaustion – Sell Risk
- Extreme bearish trend, volume dry‑up and strong sell‑side delta.
- Suggests one‑sided selling into increasingly thin liquidity.
10. Volume Climax (Buy)
- Neutral trend, neutral delta, but volume at climax levels.
- Often associated with a “big event” bar where participation spikes without a clear directional commitment.
11. Volume Climax (Sell / Dry‑Up)
- Neutral trend and neutral delta, while the volume vector indicates an extreme dry‑up.
- Highlights a stand‑still episode: very limited interest from both sides, increasing the sensitivity to future impulses.
Divergences
12. Divergence – Bullish Context
- Bullish or extreme bullish trend, but delta has faded back to neutral.
- Price trend continues while order‑flow conviction softens; can precede pauses or complex corrections.
13. Divergence – Bearish Context
- Bearish or extreme bearish trend with a neutral delta.
- Downtrend persists, but selling pressure no longer dominates as clearly.
Consolidation & Compression
14. Consolidation
- Default state when no specific pattern dominates and the market is broadly balanced.
- Educational use: treat this as a “no strong edge” label; focus on structure rather than direction.
15. Breakout Imminent
- Neutral trend with contracting volume.
- Compression phase where energy is building up; often precedes transitions into trending or shock scenarios.
Traps & Hidden Divergences
16. Bull Trap
- Bullish trend, with neutral or contracting volume and sell‑side delta.
- Price appears strong, but order‑flow shifts against it; often seen near fake breakouts or failing rallies.
17. Bear Trap
- Bearish trend, neutral or contracting volume, but buy‑side delta.
- Downtrend “looks” intact, while buyers become more aggressive underneath the surface.
18. Hidden Bullish Divergence
- Bullish trend, contracting volume, but strong buy‑side delta.
- Educational idea: price dips or slows while aggressive buyers step in, often inside an ongoing uptrend.
19. Hidden Bearish Divergence
- Bearish trend, volume expansion and strong sell‑side delta.
- Reinforced downside pressure even if price is temporarily retracing.
Reversal & Transition Patterns
20. Reversal to Bearish
- Neutral trend, volume climax and strong sell‑side delta.
- Suggests that heavy selling appears at the top of a move, turning a previously neutral or rising context into potential downside.
21. Reversal to Bullish
- Neutral trend, extreme volume dry‑up and strong buy‑side delta.
- Often associated with selling exhaustion where buyers start to take control.
22. Indecision Spike
- Neutral trend with extreme volume (climax or dry‑up) but neutral delta.
- Crowd participation changes sharply while order‑flow remains undecided; treat as an informational spike rather than a direction.
Extended Compression & Acceleration
23. Coiling Phase
- Neutral trend, contracting volume, and delta that is neutral or only mildly one‑sided.
- Extended compression where price, volume and delta all contract into a tightly coiled range, often preceding a strong move.
24. Bullish Acceleration
- Bullish trend with volume expansion and strong buy‑side delta.
- Uptrend not only continues but gains kinetic strength; educationally, this illustrates how trend, volume and delta align in the strongest phases of a move.
25. Bearish Acceleration
- Bearish trend with volume expansion and strong sell‑side delta.
- Mirror image of Bullish Acceleration on the downside.
Trend Exhaustion & Climax Reversal
26. Bull Exhaustion
- Bullish or extreme bullish trend, with contraction or dry‑up in volume and buy‑side or neutral delta.
- The move has already travelled far; participation fades while price is still elevated.
27. Bear Exhaustion
- Bearish or extreme bearish trend, with volume climax or contraction and sell‑side or neutral delta.
- Down‑move may be approaching a point where additional selling pressure has diminishing impact.
28. Blow‑Off Top
- Extreme bullish trend, volume climax and extreme buy delta all at once.
- Classic blow‑off behaviour: price, volume and order‑flow are simultaneously stretched in the same direction.
29. Selling Climax Reversal
- Extreme bearish trend with extreme volume dry‑up and extreme sell‑side delta.
- Marks a very aggressive capitulation phase that can precede major rebounds.
Advanced VSA / Anomaly Scenarios
30. Absorption
- Typically neutral trend with expanding or climax volume and extreme delta (either buy or sell).
- Educational focus: large participants are aggressively absorbing liquidity from the opposite side, while price remains relatively contained.
31. Distribution
- Scenario where volume remains elevated while directional conviction weakens and the trend slows.
- Represents potential “selling into strength” or “buying into weakness”, depending on the active side.
32. Liquidity Vacuum
- Combination of thin liquidity (extreme dry‑up) with a directional trend or strong delta.
- Highlights environments where even small orders can move price disproportionately.
33. Anomaly / Shock Event
- Triggered when the vector z‑scores detect rare combinations of price, volume and delta behaviour that deviate from their own historical distribution.
- Intended as a warning label for unusual events rather than a specific tradeable pattern.
9. Educational Usage Notes
- EMVOL does not produce mechanical “buy” or “sell” commands. Instead, it classes each bar into an interpretable state so that traders can study how trends, volume and order‑flow interact over time.
- A common exercise is to overlay your usual EMA crossovers, support/resistance or price patterns and observe which EMVOL scenarios appear around entries, exits, traps and climaxes.
- Because the vectors are normalized (bounded between ‑1 and +1) and then discretized, the same conceptual states can be compared across different symbols and timeframes.
10. Disclaimer & Educational Purpose
This indicator is provided strictly as an educational and analytical tool. Its purpose is to help visualise how price, volume and order‑flow interact; it is not designed to function as a stand‑alone trading system.
Please note:
1. No Automated Strategy – The script does not implement a complete trading strategy. Scenario labels and dashboard messages are descriptive and should not be followed as unconditional entry or exit signals.
2. No Financial Advice – All information produced by this indicator is general market analysis. It must not be interpreted as investment, financial or trading advice, or as a recommendation to buy or sell any instrument.
3. Risk Warning – Trading and investing involve substantial risk, including the risk of loss. Always perform your own analysis, use appropriate position sizing and risk management, and consult a qualified professional if needed. You are solely responsible for any decisions made using this tool.
4. Data Precision & Platform Limits – The “Intrabar (Precise)” mode depends on the availability of high‑resolution historical data at the chosen intrabar timeframe. If your TradingView plan or the symbol’s history does not provide sufficient depth, this mode may only partially cover the visible chart. In such cases, consider switching to “Geometry (Source File)” for a fully populated view.

Volume Scope Pro - Order Flow Volume Analysis V1.01Volume Scope Pro — Order Flow Volume Analysis
Overview
Volume Scope Pro is a multi-faceted volume analysis indicator that separates volume into buy (up) and sell (down) components to reveal hidden order flow dynamics. It aggregates lower timeframe volume data to estimate buying vs. selling pressure on each bar, calculates the volume delta (buy volume minus sell volume) per bar, and highlights where price action diverges or converges with volume flow. The indicator provides visual output in the form of an on-chart table and chart markers, helping traders identify potential distribution (selling into strength) and absorption (buying into weakness) events, as well as support/resistance zones derived from volume extremes.
Volume Settings
• Global Volume Period – An integer (default 100) defining the shared lookback window (in bars) for all volume-based calculations. This period is used for identifying volume extrema and computing cumulative volume statistics. A larger period considers more history for averages and sums, while a smaller period focuses on recent bars.
• Use Custom Lower Timeframe – A boolean (default true) that lets you override the automatic choice of lower timeframe for volume breakdown. If enabled, the indicator will use the specific lower timeframe you provide (see next setting) to fetch intrabar volume data. If disabled, the script chooses a lower timeframe based on the chart’s resolution (for example, 1-second for second charts, 1-minute for other intraday charts, 5-minute for daily charts, etc.).
• Lower Timeframe – A timeframe input (default 15S, i.e. 15-second intervals) specifying the lower interval to request for up/down volume calculation. This is the resolution at which the script breaks each chart bar’s volume into buying vs. selling volume. Fifteen seconds is the default as it provides a fine-grained intrabar look on most charts. This setting only takes effect if Use Custom Lower Timeframe is true; otherwise, it is ignored in favor of the automatic timeframe resolution.
Table Display Settings
• A dropdown option that adjusts the text size used in the on-chart data table (Tiny, Small, Normal, Large, Huge; default: Tiny). The default Tiny setting is selected because many traders use the indicator on mobile devices where screen space is limited. If you are using a larger display such as a laptop, desktop, or tablet, you may increase the font size to your preference for improved readability.
• Table Font Color – A color picker for the table text (default is a shade of blue, #0068e6). All text in the table will be rendered in this color. You can change it to improve contrast against your chart background or personal preference.
• Time Offset (hours) – An integer offset in hours (default 3) applied to the current time display in the table. This shifts the real-time clock readout from UTC by the specified number of hours in the table’s header. For example, setting 0 uses UTC, while a value of 3 (default) shows local time for UTC+3. Negative values are allowed for time zones behind UTC. This does not affect any calculations – it only adjusts the displayed clock for user convenience.
Trend Line & Pivot Settings
• Pivot Left and Pivot Right – Integers (default 5 each) controlling the sensitivity of pivot high/low detection. A pivot high is identified when the price high of a bar is greater than the highs of the Pivot Left bars to its left and Pivot Right bars to its right. Similarly, a pivot low is a bar whose low is lower than the lows of the surrounding bars on its left and right as defined by these values. Smaller values make the pivots more local and frequent, while larger values require more significant swings.
• Pivot Count – An integer (default 5) specifying the number of recent pivot points to track. The indicator will remember up to this many pivot highs and pivot lows each, and use them for drawing trend lines. When the count is exceeded, the oldest pivot points are dropped to focus on the most recent ones.
• Lookback Length – An integer (default 100) defining the number of bars over which trend lines are extended and within which pivot points are considered relevant. Essentially, this is the length of the window (in bars) in which the detected pivots and their connecting trend lines will be shown. Trend lines will start at the beginning of this lookback window and end at the latest bar, updating as new bars form.
• High Trend Line Color / Low Trend Line Color – Color inputs for the drawn trend lines connecting pivot highs and pivot lows, respectively (both default to orange #ff7b00). High trend lines typically slope downwards (connecting recent highs), and low trend lines slope upwards (connecting recent lows). You can change these colors to visually distinguish the two or to fit your chart theme.
• Trend Line Thickness – An integer (default 2) setting the stroke width of the pivot trend lines. Higher values make the lines thicker and more prominent.
• Trend Line Style – A string option (default dashed, options: solid, dashed, dotted) determining the line style for both high and low trend lines. For example, choosing “dotted” will draw the trend lines as a series of dots. This purely affects the appearance and has no impact on calculations.
Support/Resistance (S/R) Zone Settings
• SR Lookback Length – An integer (default 100) that defines how many completed bars are scanned for support/resistance zone detection based on volume extrema. The indicator examines this many bars behind the latest bar (the current bar is excluded to avoid repaint issues) to find extreme buying and selling volume points that form the zones. A larger value means a longer historical window for finding significant volume-based zones.
• Projection Bars – An integer (default 26, range 0–200) specifying how far into the future to extend the S/R zone lines. When set above 0, the horizontal lines marking the zones will project to the right of the latest bar by the given number of bars. This helps anticipate where the zones lie ahead of current price. A value of 0 confines the zone markings to past bars only.
• Resistance Zone Color / Support Zone Color – Color inputs for the drawn zones identified as resistance and support (defaults are red for resistance and teal for support). These colors apply to both the zone’s border lines and its background fill (with adjustable transparency, see below).
• Resistance Line Width / Support Line Width – Integers (default 2 each, range 1–5) setting the line thickness for the top and bottom boundaries of the resistance zone and support zone, respectively. For example, if Resistance Line Width is 3, the drawn lines at the top and bottom of the resistance zone will be thicker than the default.
• Resistance Fill Transparency / Support Fill Transparency – Integers in percentage (default 90 each, range 0–100) controlling the opacity of the colored shading that fills the zone area. 0% means fully opaque (solid color fill), and 100% means fully transparent (no fill color). The default of 90% is very transparent, just lightly coloring the zone area for subtlety. Adjust these to highlight the zones more prominently or to make them nearly invisible, depending on preference.
Overbought/Oversold (OB/OS) Voting Settings
• Enable OB/OS Voting – A boolean (default true) that turns on the overbought/oversold “voting” module. When enabled, the indicator evaluates standard technical indicators (RSI, Stochastic, CCI, etc.) to determine if the market is overbought (OB) or oversold (OS). Each indicator contributes an OB or OS “vote” based on its classic threshold (for example, RSI > 70 is an OB vote, RSI < 30 is OS). The module aggregates these votes to identify consensus extreme conditions.
• Enable Volume Confirmation Filter – A boolean (default true) that requires volume confirmation for OB/OS signals. If enabled, an overbought condition will only be confirmed if there is unusually high sell volume at the same time, and an oversold condition will only confirm with unusually high buy volume. In practice, this means even if indicators vote OB/OS, the script will only mark it as confirmed when volume is spiking in the opposite direction of price (signaling distribution for OB or absorption for OS). This filter helps ensure that OB/OS signals align with significant volume imbalance, indicating potential involvement of larger market participants.
• Enable Dynamic ATR Threshold – A boolean (default true) that adjusts the overbought/oversold trigger threshold dynamically based on volatility (ATR). When true, the voting threshold or confirmation conditions may be eased or tightened depending on recent volatility, as measured by the Average True Range. In higher volatility environments, this can prevent premature OB/OS signals by requiring more extreme indicator readings.
• Enable OB/OS Sync Window – A boolean (default true) that allows an OB or OS condition to remain valid for a short window of bars. If enabled, once an OB or OS state is triggered, it can persist for a user-defined number of bars (see Bars for Hit Sync Window) even if not all indicators remain in agreement every single bar. This helps to capture a cluster of OB/OS signals as one event rather than flickering on and off.
• Volume Average Period – An integer (default 3) specifying how many recent bars of volume to average when determining “unusually high” volume for confirmation. The script calculates the average buy volume and sell volume over this many bars; then the Volume Spike Ratio inputs (below) are applied to decide if current volume is significantly above average. For example, with a period of 3, the buy/sell volume of the last 3 bars are averaged to use as a baseline.
• Minimum Vote Count for OB/OS – An integer (default 3) setting the minimum number of indicators that must agree on overbought or oversold to consider it a valid signal. If fewer than this number signal OB (or OS) at the same time, the condition is ignored. A higher threshold makes the OB/OS signal rarer but more robust (requiring broader agreement among indicators).
• Bars for Hit Sync Window – An integer (default 1) controlling the size of the synchronization window (mentioned above) in bars. If an OB/OS condition is identified, it remains “active” for this many subsequent bars, allowing slightly delayed volume confirmation or indicator agreement to still count as part of the same event. For example, with a value of 2, if an OB signal occurs on one bar and the volume spike confirmation happens on the next bar, the module will treat it as a continuous event and still flag it.
• ATR Adjustment Factor – A float (default 14, step 1.0) used when Dynamic ATR Threshold is enabled. This factor influences how much ATR-based volatility adjustment is applied to the OB/OS vote threshold or confirmation criteria. A larger number might increase tolerance in volatile conditions. (Note: 14 here likely corresponds to an ATR period internally, not a direct multiplier of ATR value. It effectively adjusts sensitivity but does not need frequent change.)
• Overbought: Sell Volume Spike Ratio – A float (default 1.5) that sets the multiple of average sell volume required to confirm an Overbought condition. If the current sell volume is at least this factor times the recent average sell volume (over the Volume Average Period), and indicators are signaling OB, then an Overbought state is confirmed. For instance, the default 1.5 means sell volume must be 150% or more of its average to validate an OB signal. This ensures that an overbought label is only shown when there’s evidence of heavy selling (distribution) accompanying the price being overbought.
• Oversold: Buy Volume Spike Ratio – A float (default 2.0) setting the multiple of average buy volume required to confirm an Oversold condition. With the default 2.0, the current buy volume needs to be at least 200% of its recent average for an OS signal to confirm. This indicates strong buying interest (absorption) when price is in an oversold state. Typically, oversold conditions with significant buy volume could precede upward reversals.
• Source – A price source input (default close) for OB/OS calculations. This is the series value passed into the 20 indicator calculations (RSI, Stoch, etc.). By default it uses closing price, but advanced users can change it (for example, to an HLC3 or other composite) if desired. Generally, leaving it as close is standard.
Indicator Calculations and Logic
Volume Data Aggregation and Delta Calculation
At the core of Volume Scope Pro is the separation of total volume into up-volume (buying) and down-volume (selling) on each bar. This is achieved by requesting lower timeframe data using TradingView’s built-in requestUpAndDownVolume() function. Specifically, for each chart bar, the script gathers volume from a lower timeframe interval (e.g., 15-second bars) that fits within the higher timeframe bar. It sums the volume of all lower-TF sub-bars where price moved up (buy volume) vs. down (sell volume), providing an estimate of how much of the volume was transacted at the ask (buys) versus at the bid (sells). The resulting values are stored as upVolume and downVolume for the current bar, and the volume delta is computed as deltaVolume = upVolume – downVolume. By default, the script ensures upVolume and downVolume are treated as absolute magnitudes, while deltaVolume can be positive or negative indicating net buy or sell dominance.
If Use Custom Lower Timeframe is disabled, the indicator automatically chooses an appropriate lower timeframe based on the chart’s resolution. This adaptive logic uses 1-second intervals for charts in seconds, 1-minute for intraday minutes, 5-minute for daily charts, and 60-minute for anything higher, ensuring that up/down volume can be computed across various chart periods. If even finer resolution is needed or the user prefers a specific timeframe (e.g., 15S), enabling the custom option allows that override.
Coverage:
Because not all historical bars will have lower timeframe data available (especially if looking far back or on certain assets/timeframes), the script tracks how many bars actually received a valid up/down volume calculation. Each bar with non-na deltaVolume is counted toward a coverage total . This coverage count is displayed in the table (as “Coverage: X Bars”) to inform the user how many bars in the dataset had full volume breakdown data. It also serves a technical purpose: certain moving averages or calculations are “gated” to only output values when enough data points exist. For example, a 20-bar average of buy volume will not be shown until at least 20 bars with volume data are present; until then it returns NA to avoid misleading results. This gating mechanism is implemented via helper functions that check coverage before computing moving averages or sums. In practice, if you apply the indicator to a fresh chart or after changing the lower timeframe setting, you may see “NA” placeholders for some values until sufficient bars accumulate.
Volume Averages and Recent Change Indicators
For both buy and sell volume, the script computes short-term and medium-term averages to contextualize the current bar’s activity. Specifically, it calculates a 3-bar simple moving average and a 20-bar simple moving average of upVolume and downVolume (these lengths are fixed and chosen to represent a fast vs. slow window). These averages are shown in the table to compare against the current volume:
• The “Buy Current Amount” is the current bar’s buy volume, shown in an engineered format (e.g., 1.25K for 1,250) for readability. Directly below it (in the same cell via a newline) is “Avg : (3 | 20)”, which lists the 3-bar average buy volume and 20-bar average buy volume. Each average value is followed by an arrow marker:
an upward arrow 🔼 means the current buy volume is higher than that average, whereas a downward arrow 🔻 means the current buy volume is lower than that average. These markers give a quick visual cue – for instance, a 🔼 next to the (3) average indicates a volume spike in the very short term (current bar’s buy volume exceeds the recent 3-bar norm). If not enough data exists to compute an average, “NA” is displayed with the window in parentheses (e.g., “NA (20)” if fewer than 20 bars of coverage). The same format is used for Sell volume, where “Sell Current Amount” is the current bar’s sell volume with its own 3-bar and 20-bar averages and markers.
In addition to the short/medium term averages, the script also computes a “global” average buy volume and sell volume over the full Global Volume Period (using a slightly different approach). It first finds the proportion of buy vs sell over that window (summing all upVolume and downVolume over L = Global Volume Period bars) and then multiplies that ratio by the average total volume on the chart timeframe. This yields an implied average buy volume and sell volume for the global window (taking into account that the chart’s own volume may differ from summed LTF volume due to how the LTF data is sampled). These global averages are used internally (for example, in the OB/OS volume filter logic) but are not explicitly printed in the table. Instead, the table provides a more direct insight: the Positive Δ Sum and Negative Δ Sum (explained later) show accumulated buying vs selling pressure over the lookback period.
Price and Volume Trend Convergence/Divergence
Volume Scope Pro analyzes the short-term and medium-term trends of price and volume to identify convergence or divergence between price movement and buy/sell activity. This is done by calculating the angle of linear regression (slope in degrees) for price and for volume over the same two windows (3 bars and 20 bars). In essence, it fits a line through the last 3 closes and measures its angle, and similarly fits lines through the last 3 buy-volume values, last 3 sell-volume values, and repeats for 20 bars. The angles for price vs. volume are then compared:
• For the buy side, the indicator computes the price angle (θ) over 3 bars and 20 bars, and the buy-volume angle over 3 and 20 bars. These are displayed in the table under a “Buy Volume Trend” row. For example, it might show: “Price θ: 12.5° (3) | 5.0° (20)” on one line and “BuyVol θ: 8.0° (3) | 2.0° (20)” on the next. Each angle is given in degrees (θ symbol) with one decimal precision. A positive angle means an uptrend (price or volume increasing), and a negative angle means a downtrend over that window.
• After listing the angles, a convergence/divergence label is shown for each window: either Convergent or Divergent for the 3-bar window and similarly for the 20-bar window. This indicates whether price and buy volume are moving in the same direction (convergent) or opposite directions (divergent). For instance, if price’s 3-bar trend is up (positive slope) but buy-volume’s 3-bar trend is down (negative slope), that would be Divergent (3), signaling a short-term anomaly (price rising on falling buy volume). Conversely, if both price and buy volume are rising together over 20 bars, that shows Convergent (20), indicating buy volume is supporting the uptrend. These convergence/divergence labels help identify potential early warning signs: divergence may precede a reversal or indicate that an observed price move lacks volume support.
The same analysis is done for the sell side. The table’s “Sell Volume Trend” row lists “Price θ: ... | ...” and “SellVol θ: ... | ...” for 3 and 20 bars , followed by labels showing whether price vs. sell volume trends are convergent or divergent over those periods. For example, if price is trending down (negative angle) while sell volume is also trending down, they are Convergent (both indicating selling pressure in line with price drop). If price is falling but sell volume trend is up, that’s Divergent – price decrease accompanied by increasing sell volume could indicate aggressive selling (potential capitulation or acceleration of downtrend). On the other hand, price falling with decreasing sell volume might suggest selling is drying up (potential for a bottom). These nuances can be gleaned from the convergence/divergence outputs.
All angle calculations use a normalized linear regression slope converted to degrees for easy interpretation. The use of a short (3) and longer (20) window provides a quick glance at immediate vs. recent trend alignment. In the table, the angles and convergence labels are organized in two lines for buy and two lines for sell to clearly separate the information.
Volume Delta and Cumulative Delta Sums
The Volume Delta (Δ) for the current bar is a key metric showing the net difference between buy and sell volume. In the table, it appears as a single-line entry like “Delta: 5.2K” (for example) in the volume delta row. The value is formatted with K/M/B suffix if large, and it is colored green if positive (indicating net buying pressure) or red if negative (net selling pressure), with a neutral color if essentially zero. This coloring provides instant visual feedback: a green Delta means buyers dominated that bar, whereas a red Delta means sellers dominated. The delta number itself helps gauge the magnitude of that dominance. For instance, “Delta: 1.5M” in green would signify a very large imbalance of buying volume on that bar. This row gives a per-bar order flow insight complementing the price action of the candle.
To assess the broader context, the indicator also computes cumulative delta sums over the Global Volume Period. It separately accumulates all positive delta values and all negative delta values within the lookback window (e.g., 100 bars). The results are shown in the table as two lines: Positive Δ Sum and Negative Δ Sum, each followed by a number. These represent the total volume imbalance accumulated in each direction over the window. For example, a Positive Δ Sum of 20K means that, summing all bars in the window where buy > sell volume, buyers were ahead by a total of 20,000 volume (volume units) in that period. Similarly, a Negative Δ Sum of 15K would mean sellers were ahead by 15,000 volume in other bars. These sums give a sense of who is in control over the recent horizon: if Positive Δ Sum greatly exceeds Negative Δ Sum, the market has seen net accumulation (buying) in the lookback; if the reverse, net distribution (selling). The values are shown in a neutral text color (since they are not inherently “good” or “bad”) and are formatted with K/M suffixes as needed. They can help confirm trends or identify subtle shifts – for instance, if price is flat but Positive Δ Sum is growing rapidly, it might indicate stealth accumulation even without price movement.
Support/Resistance Zone Detection from Volume Extremes
Volume Scope Pro identifies key support and resistance areas by analyzing how volume behaved in recent price movements. Zones are derived from points where buying or selling activity became unusually strong or unusually weak—areas that often act as reaction levels in future price action.
A high-activity region is highlighted as a Resistance Zone, showing where strong participation previously slowed upward movement.
A low-activity region forms a Support Zone, indicating price levels where the market tended to stabilize or absorb pressure.
These zones are displayed as horizontal regions projected forward on the chart, with customizable colors and styling. Their upper and lower boundaries are shown in the on-chart table, where the indicator also notes whether each zone currently acts as support or resistance based on price position.
🟥 Resistance Zone based on
Buy/Sell Amount: 1.2345 ~ 1.2500
This indicates a resistance zone between roughly 1.2345 and 1.2500 (the bottom and top of that zone). “Buy/Sell Amount” here refers to the fact that this zone was computed from extreme buy/sell volume events, and the values are the zone’s price range. Likewise, a support zone line would be prefixed with 🟩 and show its range. These zones give a unique volume-based perspective on support and resistance, complementing traditional price-based levels.
Pivot-Based Trend Lines
The indicator draws adaptive trendlines by tracking recent swing highs and swing lows. Whenever the market forms meaningful pivots, the tool connects these points to outline the active upward and downward trend structure. A line drawn through recent highs generally acts as a dynamic resistance guide, while a line drawn through lows often behaves as a rising support boundary.
As market structure evolves, the trendlines update automatically, keeping the analysis aligned with the most recent swings. The color, thickness, and style of these lines are fully customizable. At any moment, you may see one line tracking the upper structure and one line tracking the lower structure, helping identify potential breakout areas or trend-channel behavior without manual drawing.
Overbought/Oversold Voting and Volume Signals
Volume Scope Pro includes an Overbought/Oversold engine that evaluates market exhaustion by combining technical momentum signals with real volume behavior. Instead of relying on a single indicator, the system draws from a broad set of classical oscillators, creating a multi-layer confirmation approach.
The tool aggregates signals from a group of well-known indicators and identifies when several of them simultaneously reach extreme levels. When enough of these indicators align, the condition is considered overbought or oversold. To refine these readings, an optional volume filter checks whether buying or selling pressure is unusually strong at the same time.
• Overbought (OB) is highlighted only when technical exhaustion coincides with elevated sell volume.
• Oversold (OS) appears when oversold readings align with strong buy volume.
When confirmed, the indicator places clear visual markers on the chart:
• OB – potential topping conditions supported by heavy selling.
• OS – potential bottoming conditions supported by strong buying.
• Distribution (↑P ↑S) – price rising while selling pressure increases.
• Absorption (↓P ↑B) – price falling while buyers absorb the move.
• Combined signals (OB+DIST or OS+ABS) highlight the strongest forms of exhaustion.
These markings help traders quickly recognize areas where momentum is fading and volume behavior becomes important. While they do not predict exact turning points, they often appear during phases where the market prepares for a shift, consolidation, or slowing trend.
Usage Notes and Interpretation
Volume Scope Pro provides a detailed view into the internal dynamics of market volume, which can greatly aid analysis when used appropriately. Here are some important considerations and best practices:
• Data Availability (Coverage): The accuracy and utility of this indicator depend on the availability of lower timeframe data for the instrument. On very high timeframe charts (weekly/monthly) or illiquid symbols, the automatic lower timeframe (like 1 minute or 5 minutes) might not retrieve full historical intrabar data, resulting in limited coverage. This is indicated in the “Coverage: X Bars” readout. If coverage is low, many of the volume-based values (especially 20-bar averages or global sums) may show “NA” or be unrepresentative until more data accumulates. It’s often best to use this indicator on active symbols and reasonable timeframes (e.g., 1h, 4h, 1D with a few months of data or lower) to ensure plenty of sub-bar data is available. If needed, you can reduce the Global Volume Period to focus on a smaller window that has full coverage, or experiment with a different Lower Timeframe that might have more data available (for example, using 1min instead of 15s on very long histories).
• Interpreting Volume Delta and Trends: A key value to watch is the Delta (Δ) and how it changes. For instance, if price is making new highs but Δ is decreasing or negative, it indicates bearish divergence – fewer buyers are supporting the move, or sellers might be increasingly active (distribution). Conversely, price making new lows while Δ becomes less negative or turns positive is a bullish divergence, implying sellers are exhausting and buyers are stepping in (absorption). The convergence/divergence rows quantitatively highlight these situations. Use them as alerts to investigate further rather than automatic trade signals. For example, a divergent 20-bar trend (price up, buy volume down) doesn’t mean price will immediately reverse, but it does warrant caution as the rally may be on weak footing.
• Support/Resistance Zones: The volume-derived S/R zones offer levels that might not be obvious from price alone. They often pinpoint areas where the tug-of-war between buyers and sellers was most extreme (resistance zone) or where the market had a lull in volume (support zone). Treat these zones as you would conventional support/resistance: price may react when revisiting them. A common use is to watch how price behaves upon approaching a highlighted zone – for instance, if price rallies into a red resistance zone and you see volume delta start to flip negative, it could strengthen the case that the zone is indeed acting as resistance due to renewed selling. The zones update once a new volume extreme enters or exits the lookback window, so they are relatively static during most recent price action, shifting only when a significantly larger volume spike happens or the oldest bar in the window moves out. They are also non-repainting for completed bars (the algorithm excludes the current bar for zone calculation to avoid repaint issues). Keep in mind these zones are horizontal areas; they do not guarantee a reversal, but they mark where supply or demand was notably strong in the past, which is useful context.
• Trend Lines and Pivots: The automatic trend lines drawn from pivot highs and lows can help visualize short-term price channels or triangles. They update in real-time as new pivots form. Use them as guidance for potential breakout or breakdown levels – e.g., if price breaks above a descending high line, that could indicate a bullish breakout from the recent down trend. The pivot detection sensitivity (Pivot Left/Right) can be tuned: higher values will only draw lines across more significant swings, whereas lower values will catch minor swings too. Adjust according to the volatility of the asset (more volatile assets might need larger pivot settings to filter noise). The trend lines are an auxiliary feature in this volume tool, meant to save time drawing those lines manually for recent swings. They work best when recent pivots are clear; in choppy conditions with many equal highs/lows, you might see the lines adjust frequently.
• OB/OS Voting Signals: The overbought/oversold markers (OB, OS, distribution, absorption) are perhaps the most actionable signals from this script, but they should not be used in isolation. They effectively combine momentum and volume analysis. A prudent approach is to confirm these signals with price action or other analysis:
• An “OB” (Overbought) marker suggests a probable short opportunity or at least to be cautious with longs. When you see OB, check if it aligns with other factors: Is price at a known resistance or a volume zone? Is there a bearish candlestick pattern? Multiple OB signals in a cluster (with or without “DIST”) could indicate a topping process – you might wait for price to start rolling over before acting.
• An “OS” (Oversold) marker points to a potential long opportunity or caution with shorts. Look for confluence such as the price being at a support zone, a bullish divergence in delta, or a reversal candle. Sometimes one OS by itself might just lead to a small bounce in an ongoing downtrend, but a series of OS/ABS signals could mark a accumulation phase.
• Distribution (↑P↑S) and Absorption (↓P↑B) markers can appear even without full OB/OS votes. These warn of stealthy behavior: e.g., Distribution triangles showing up during a steady uptrend might precede larger profit-taking drops. Absorption triangles in a downtrend might precede a relief rally. They are early warnings – pay attention if they start to cluster or coincide with known S/R levels.
• The combined labels OB+DIST and OS+ABS are stronger alerts since they mean both the indicators and volume are screaming extreme. These are relatively rarer; when they appear, the likelihood of at least a short-term reversal is higher. Still, disciplined risk management is essential as markets can remain overbought/oversold longer than expected.
• No Guarantees & Context: It’s important to emphasize that none of these outputs guarantee a price will move in a certain direction. They highlight conditions that historically often precede moves. Volume Scope Pro should be used as an informational tool to augment your analysis. For example, you might use it to confirm a breakout (volume delta turning strongly positive on a price break) or to spot divergence (price making a new high but Δ Sum not increasing). Always consider the broader context: trend direction, higher timeframe signals, fundamental news, etc. A bullish signal in a strong downtrend may only yield a minor correction, and a bearish signal in a roaring uptrend might just be a pause.
• Avoiding Over-Optimization: The indicator comes with many inputs. It might be tempting to tweak them frequently, but it’s recommended to start with defaults and adjust only if you understand the effect. For instance, if you increase Minimum Vote Count for OB/OS, you’ll get fewer but more conservative signals – you might miss early warnings. Changing Volume Spike Ratios alters how sensitive the volume filter is – lower ratios give more signals (even on modest volume rises) but risk false alarms. Use these settings to tailor the indicator to the asset or timeframe (e.g., a very high-volume asset might justify a higher spike ratio). The defaults have been chosen to suit a wide range of scenarios reasonably well.
• Performance and Chart Load: Volume Scope Pro does heavy processing by requesting a lower timeframe and calculating many values. On some platforms, loading this indicator might be slightly slower or consume more memory. It’s invite-only and not open-source, which means the calculations happen behind the scenes. If you experience any slowness, you can try using a less granular lower timeframe (e.g., 1min instead of 15s) or reduce the Global Volume Period to lighten the load. Generally it runs efficiently, but be mindful if stacking it with many other complex indicators.
In summary, Volume Scope Pro provides a set of volume-centric insights: from basic buy/sell volume split and delta, to trend alignment, to volume-profile S/R levels, to multi-indicator OB/OS warnings with volume validation. It adheres strictly to providing factual, data-driven information with no predictive guarantees. Traders can utilize this tool to observe where large buyers or sellers might be operating (“smart money”), detect when volume behavior contradicts price (a sign of potential reversals), and identify hidden support and resistance zones. All these pieces of information, when combined with sound strategy and risk management, can improve decision-making. Always remember to use this indicator as one part of a comprehensive analysis.

GRG/RGR Signal, MA, Ranges and PivotsThis indicator is a combination of several indicators.
It is a combination of two of my indicators which I solely use for trading
1. EMA 10-20-50-200, Pivots and Previous Day/Week/Month range
2. 3/4-Bar GRG / RGR Pattern (Conditional 4th Candle)
You can use them individually if you already have some of them or just use this one. Belive me when I say, this is all you need, along with market structure knowlege and even if you don’t have that, this indicator has been doing wonders for me. This is all I use. I do not use anything else.
**Note - Do checkout the indicators individually as I have added valuable information in the comment section.
It contains the following,
1. 10 EMA/SMA - configurable
2. 20 EMA/SMA - configurable
3. 50 EMA/SMA - configurable
4. 200 EMA/SMA - configurable
5. Previous Day's Range - configurable
6. Previous Week's Range - configurable
7. Previous Month's Range - configurable
8. Pivots - configurable
9. Buy Sell Signal - configurable
The Moving Averages
It is a very important combination and using it correctly with price action will strengthen your entries and exits.
The ema's or sma's added are the most powerful ones and they do definitely act as support and resistance.
The Daily/Weekly/Monthly Ranges
The Daily/Weekly/Monthly ranges are extremely important for any trader and should be used for targets and reversals.
Pivots
Pivots can provide support and resistance level. R5 and S5 can be used to check for over stretched conditions. You can customise them however you like. It is a full pivot indicator.
It is defaulted to show R5 and S5 only to reduce noise in the chart but it can be customised.
The 3/4 RGR or GRG Signal Generator
Combined with a 3/4 RGR or GRG setup can be all a trader needs.
You don't need complex strategies and SMC concepts to trade. Simple EMAs, ranges and RGR/GRG setup is the most winning combination.
This indicator can be used to identify the Green-Red-Green or Red-Green-Red pattern.
It is a price action indicator where a price action which identifies the defeat of buyers and sellers.
If the buyers comprehensively defeat the sellers then the price moves up and if the sellers defeat the buyers then the price moves down.
In my trading experience this is what defines the price movement.
It is a 3 or 4 candle pattern, beyond that i.e, 5 or more candles could mean a very sideways market and unnecessary signal generation.
How does it work?
Upside/Green signal
1. Say candle 1 is Green, which means buyers stepped in, then candle 2 is Red or a Doji, that means sellers brought the price down. Then if candle 3 is forming to be Green and breaks the closing of the 1st candle and opening of the 2nd candle, then a green arrow will appear and that is the place where you want to take your trade.
2. Here the buyers defeated the sellers.
3. Sometimes candle 3 falls short but candle 4 breaks candle 1's closing and candle 2's opening price. We can enter on candle 4.
4. Important - We need to enter the trade as soon as the price moves above the candle 1 and 2's body and should not wait for the 3rd or 4th candle to close. Ignore wicks.
5. But for a more optimised entry I have added an option to use candle’s highs and lows instead of open and close. This reduces lot of noise and provides us with more precise entry. This setting is turned on by default.
6. I have restricted it to 4 candles and that is all that is needed. More than that is a longer sideways market.
7. I call it the +-+ or GRG pattern or Green-Red-Green or Buyer-Seller-Buyer or Seller defeated or just Buyer pattern.
8. Stop loss can be candle 2's mid for safe traders (that includes me) or candle 2's body low for risky traders.
9. Back testing suggests that body low will be useless and result in more points in loss because for the bigger move this point will not be touched, so why not get out faster.
Downside/Red signal
1. Say candle 1 is Red, which means sellers stepped in, then candle 2 is Green or a Doji, that means buyers took the price up. Then if candle 3 is forming to be Red and breaks the closing of the 1st candle and opening of the 2nd candle then a Red arrow will appear and that is the place where you want to take your trade.
2. Sometimes candle 3 falls short but candle 4 breaks candle 1's closing and candle 2's opening price. We can enter on candle 4.
3. We need to enter the trade as soon as the price moves below the candle 1 and 2's body and should not wait for the 3rd or 4th candle to close.
4. But for a more optimised entry I have added an option to use candle’s highs and lows instead of open and close. This reduces lot of noise and provides us with more precise entry. This setting is turned on by default.
5. I have restricted it to 4 candles and that is all that is needed. More than that is a longer sideways market.
6. I call it the -+- or RGR pattern or Red-Green-Red or Seller-Buyer-Seller or Buyer defeated or just Seller pattern.
7. Stop loss can be candle 2's mid for safe traders ( that includes me) or candle 2's body high for risky traders.
8. Back testing suggests that body high will be useless and result in more points in loss because for the bigger move this point will not be touched, so why not get out faster.
Combining Indicators and Signal
Combining these indicators with GRG/RGR signal can be very powerful and can provide big moves.
1. MA crossover and Signal - This is very powerful and provides a very big move. Trades can be held for longer. If after taking the trade we notice that the MA crossover has happened then trades can be held for higher targets.
2. Pivots and Signal - Pivots and add a support or resistance point. Take profits on these points. R5/S5 are over streched conditions so we can start looking for reversal signals and ignore other signals
3. Intraday Range - first 1, 5, 15 min of the day - Sideways days is when price will stay in these ranges. You can take profits at these ranges or if the range is broken and we get a signal, then it can mean that the direction will be sustained.
4. Previous Day/Week/Month Ranges - These can be used as Take Profit points if the price is moving towards them after getting the signal. If the range is broken and we get a signal then it can be a strong signal. They can also be used as reversal points if a strong signal is generated.
Important Settings
1. Include 4th Candle Confirmation - You can enable or disable the 4th candle signal to avoid the noise, but at times I have noticed that the 4th candle gives a very strong signal or I can say that the strong signal falls on the 4th candle. This is mostly a coincidence.
2. Bars to check (default 10) - You can also configure how many previous bars should the signal be generated for. 10 to 30 is good enough. To backtest increase it to 2000 or 5000 for example.
3. Use Candle High/Low for confirmation instead of Candle Open/Close - More optimized entry and noise reduction. This option is now defaulted to false.
4. Show Green-Red-Green (bull) signals - Show only bull entries. Useful when I have a predefined view i.e, I know market is going to go up today.
5. Show Red-Green-Red (bear) signals - Show only bear entries. Useful when I have a predefined view i.e, I know market is going to go down today.
6. 3rd candle should be a Strong candle before considering 4th candle - This will enforce additional logic in 4 candle setup that the 3rd candle is the candle in our direction of breakout. This means something like GRGG is mandatory, which is still the default behaviour. If disabled, the 3rd candle can be any candle and 4th candle will act as our breakout candle. This behaviour has led to breakouts and breakdowns as times, hence I added this as a separate feature. Vice-versa for a RGGR.
For a 4 candle setup till now we were expecting GRGG or RGRR but we can let the system ignore the 3rd candle completely if needed.
This will result in additional signals.
7. Three intraday ranges added for index and stock traders - 1 min, 5 min and 15 min ranges will be displayed. These are disabled by default except 15 min. These are very important ranges and in sideways days the price will usually move within the 15 min. A breakout of this range and a positive signal can be a very powerful setup.
Safe traders can avoid taking a trade in this range as it can lead to fakeouts.
The line style, width, color and opacity are configurable.
Pointers/Golden Rules
1. If after taking the trade, the next candle moves in your direction and closes strong bullish or bearish, then move SL to break even and after that you can trail it.
2. If a upside trade hits SL and immediately a down side trade signal is generated on the next candle then take it. Vice versa is true.
3. Trades need to be taken on previous 2 candle's body high or low combined and not the wicks.
4. The most losses a trader takes is on a sideways day and because in our strategy the stop loss is so small that even on a sideways day we'll get out with a little profit or worst break even.
5. Hold trades for longer targets and don't panic.
6. If last 3-4 days have been sideways then there is a good probability that today will be trending so we can hold our trade for longer targets. Inverse is true when the market has been trending for 2-3 days then volatility followed by sideways is coming (DOW theory). Target to hold the trade for whole day and not exit till the day closes.
7. In general avoid trading in the middle of the day for index and stocks. Divide the day into 3 parts and avoid the middle.
8. Use Support/Resistance, 10, 20, 50, 200 EMA/SMA, Gaps, Whole/Round numbers(very imp) for identifying targets.
9. Trail your SL.
10. For indexes I would use 5 min and 15 min timeframe and at times 10 mins.
11. For commodities and crypto we can use higher timeframe as well. Look for signals during volatile time durations and avoid trading the whole day. Signal usually gives good targets on those times.
12. If a GRG or RGR pattern appears on a daily timeframe then this is our time to go big.
13. Minimum Risk to Reward should be 1:2 and for longer targets can be 1:4 to 1:10.
14. Trade with small lot size. Money management will happen automatically.
15. With small lot size and correct Risk-Reward we can be very profitable. Don't trade with big lot size.
16. Stay in the market for longer and collect points not money.
17. Very imp - Watch market and learn to generate a market view.
18. Very imp - Only 3 type of candles are needed in trading -
Strong Bullish (Big Green candle), Strong Bearish (Big Red candle),
Hammer (it is Strong Bullish), Inverse Hammer (it is Strong Bearish)
and Doji (indecision or confusion).
If on daily timeframe I see Strong Bullish candle previous day then I am biased to the upside the next day, if I see Strong Bearish candle the previous day then I am biased to the downside the next day, if I see Doji on the previous day then I am cautious the next day, if there are back to back Dojis forming in daily or weekly then I am preparing for big move so time to go big once I get the signal.
19. Most Important Candlestick pattern - Bullish and Bearish Engulfing
20. The only Chart patterns I need -
a) Falling Wedge/Channel Bullish Pattern Uptrend or Bull Flag - Buying - Forming over a couple days for intraday and forming over a couple of weeks for swing
b) Falling Wedge/Channel Bullish Pattern Downtrend or Falling Channel - Buying
c) Rising Wedge Bearish Pattern Uptrend or Rising Channel - Selling
d) Rising Wedge Bearish Pattern Downtrend or Bear flag - Selling
e) Head and Shoulder - Over a longer period not for intraday. In 15 min takes few days and for swing 1hr or 4h or daily can take few days
f) M and W pattern - Reversal Patterns - They form within the above 4 patterns, usually resulting in the break of trend line
21. How Gaps work -
a) Small Gap up in Uptrend - Market can fill the gap and reverse. The perception is that people are buying. If previous day candle was Strong Bullish then market view is up.
b) Big Gap up in Uptrend - Not news driven - Profit booking will come but may not fill the entire gap
c) Big Gap up in Uptrend - News driven, war related, tax, interest rate - Market can keep going up without stopping.
c) Flat opening in Uptrend - Big chance of market going up. If previous day candle was Strong Bullish then view is upwards, if it was Doji then still upwards.
d) Gap down in Uptrend - Market is surprised. After going down initially it can go up
e) Small Gap down in Downtrend - Market can fill the gap and keep moving down. If previous day candle was Strong Bearish then view is still down.
f) Flat opening in Downtrend - View is down, short today.
g) Big Gap down in Downtrend - Profit booking and foolish buying will come but market view is still down.
h) Gap down with News - Volatility, sideways then down.
i) Gap Up in Downtrend - Can move up - Price can move up during 2/3rd of the day and End of the day revert and close in red.
22. Go big on bearish days for option traders. Puts are better bought and Calls are better sold.
23. Cluster of green signals can lead to bigger move on the upside and vice versa for red signals.
24. Most of this is what I learned from successful traders (from the top 2%) only the indicator is mine.

Volume Imbalance Analyzer - 70% & 80% Version1.01Here’s a clean “definition” you can drop into your docs. It explains **what** the indicator is, **what it helps with**, and **how** to use it—plain and practical.
# Definition
**Volume Imbalance Analyzer (70% & 80%)** flags bars where estimated buy vs. sell volume is heavily one-sided. It colors those bars, adds labels (B70/B80 or S70/S80), and can alert you in real time. The goal is to quickly spot spots of **aggressive participation** (buyers or sellers) that often act as magnets for a **retest** or as **exhaustion/continuation** areas.
# What it helps you do
* **Find high-energy bars** where one side dominates (potential turning or continuation points).
* **Plan retests:** Track when price comes back into the imbalance candle’s range (common entry/take-profit logic).
* **Filter trades:** Only act when the market shows unusual pressure (≥70% or ≥80%).
* **Add context to setups:** Combine with S/R, FVGs, or trend tools to time entries with less guesswork.
* **Alert-driven workflow:** Get notified the moment extreme pressure prints.
# How it helps (workflow)
1. **Scan for signals:**
* **B80/B70** = strong buying; **S80/S70** = strong selling.
* 80% is “extreme” and overrides 70%.
2. **Mark the zone:** The imbalance candle’s **high–low** defines a zone. Many traders wait for a **retest** into that range.
3. **Decide intent:**
* After **B80/B70**, look for pullbacks to buy (or fades if you see exhaustion).
* After **S80/S70**, look for rallies to sell (or fades if exhaustion).
4. **Confirm with context:** Check trend, key levels, liquidity, session timing, ATR/volatility.
5. **Manage risk:** Place stops beyond the zone; size trades so a failed retest doesn’t ruin the day.
# How it works (under the hood, briefly)
The script **estimates buy/sell volume** from each candle’s body, wicks, and total volume, then computes an **imbalance %**. If the % crosses **70%** or **80%** (scaled by a Sensitivity setting), it paints the bar, drops a label, and optionally fires an alert. It also stores the imbalance candle’s range so you can watch for a **retest**.
# Reading the signals (quick guide)
* **B80**: Extreme buyer pressure → watch for pullback buys or exhaustion shorts, depending on context.
* **B70**: Strong buyer pressure → mild continuation bias.
* **S80**: Extreme seller pressure → watch for rally sells or exhaustion longs.
* **S70**: Strong seller pressure → higher reversal probability noted in the table (informational).
# Configuration tips
* **Sensitivity**: Higher = more bars qualify (more signals).
* **Label distance**: Scales with ATR so labels don’t overlap candles.
* **Colors/opacity**: Separate for 70% vs 80% and buyer vs seller.
* **Alerts**: Enable to catch signals live without staring at the screen.
# Notes & limits
* Uses **estimation** (not true bid/ask) on most symbols; treat as a **context tool**, not a stand-alone system.
* The optional stats table’s “expected outcomes” are **informational**, not live probabilities.
* Works on any timeframe; results improve when combined with structure and risk controls.

IQ_Trader's Technical Scoring System With SignalsThe IQ Trader's Technical Scoring System is a sophisticated trading indicator designed to assist traders in identifying potential BUY and SELL opportunities using a dynamic scoring mechanism.
By combining traditional technical indicators (SMA, MACD) with a custom Adaptive Gaussian Moving Average (AGMA) and Bayesian trend probability analysis, this indicator provides a comprehensive view of market conditions. It generates multiple signal types to support various trading strategies, including main BUY/SELL signals, additional BUYS/SELLS signals, and STOP/STRONG STOP signals for risk management.
Key Features
Dynamic Scoring System:
The indicator calculates separate Buy and Sell scores based on multiple conditions, including:
Price position relative to daily SMA50 and SMA200.
Price position relative to the Adaptive Gaussian Moving Average (AGMA).
Bayesian trend analysis incorporating RSI, MACD, EMA, ATR, and volume zones.
MACD position and crossover/crossunder events.
Scores are displayed in a table, showing the contribution of each component (e.g., "Price > SMA50: 20") for transparency.
Signal Types:
Main BUY/SELL Signals:
Triggered when the Buy/Sell score falls within user-defined dynamic thresholds (adjustable for above/below SMA50 conditions).
Controlled by an inTrade state to prevent overlapping signals (BUY only when not in a trade, SELL only when in a trade).
Disabled by default; enable via settings ("Enable Main BUY Signals" and "Enable Main SELL Signals").
Additional BUYS/SELLS Signals:
Generated when the Buy score exceeds the Sell score (BUYS) or vice versa (SELLS).
Sequentially alternates (BUYS → SELLS → BUYS) to avoid repetitive signals, using an inBuysState mechanism.
Always enabled for quick trend insights.
STOP/STRONG STOP Signals:
STOP: Triggered when the price is above SMA50 and MACD crosses below the signal line in a lower timeframe.
STRONG STOP: Triggered when the price is above SMA50, MACD is below the signal line, and the price is below AGMA in a lower timeframe.
Disabled by default; enable via settings ("Enable STOP Signals" and "Enable STRONG STOP Signals").
Useful for risk management and exiting positions.
Visual and Customization Options:
Plots: Displays daily SMA50, SMA200, AGMA, MACD, and MACD Signal lines, all toggleable via settings.
Score Table: Shows real-time Buy and Sell score components at the top center of the chart.
Signal Markers:
Main BUY: Green label ("BUY") below the bar.
Main SELL: Red label ("SELL") above the bar.
BUYS: Lime triangle up ("BUYS") below the bar.
SELLS: Fuchsia triangle down ("SELLS") above the bar.
STOP: Orange triangle down ("STOP") above the bar.
STRONG STOP: Red triangle down ("STRONG") above the bar.
Settings: Highly customizable thresholds, enable/disable conditions, and plot visibility.
Alert Support:
Configurable alerts for all signal types (Dynamic BUY, Dynamic SELL, BUYS, SELLS, STOP, STRONG STOP).
Alerts are gated by enable settings for main BUY/SELL and STOP/STRONG STOP signals to prevent unwanted notifications.
How to Use
Add the Indicator:
Apply the indicator to your chart via TradingView’s Pine Editor or Indicator Library.
By default, only the additional BUYS/SELLS signals are active, along with SMA50/200, AGMA, and MACD plots.
Customize Settings:
Thresholds: Adjust buyThresholdLow, buyThresholdHigh, etc., to fine-tune the sensitivity of main BUY/SELL signals.
Enable Signals: Check "Enable Main BUY Signals", "Enable Main SELL Signals", "Enable STOP Signals", or "Enable STRONG STOP Signals" to activate these signals.
Toggle Plots: Use "Show Daily SMA50/200", "Show AGMA", and "Show MACD and Signal Line" to control chart visuals.
Score Conditions: Enable/disable individual score components (e.g., "Price Above Daily SMA50") to focus on specific indicators.
Interpret Signals:
Main BUY/SELL: Use for primary entry (BUY) and exit (SELL) decisions, ideal for swing or trend-following strategies.
BUYS/SELLS: Monitor for early trend changes or confirmation of momentum, suitable for shorter-term trades.
STOP/STRONG STOP: Consider as warnings to tighten stops or exit positions, especially in volatile markets.
Check the score table to understand which conditions are driving the signals.
Set Alerts:
Create alerts for desired signals (e.g., "Dynamic BUY Signal") via TradingView’s alert menu.
Ensure the corresponding signal is enabled in settings to receive alerts.
Notes for Traders
Timeframe Flexibility: The indicator adapts to different timeframes, with lower timeframe MACD and AGMA calculations for STOP signals. Test on your preferred timeframe (e.g., 1H, 4H, 1D).
Risk Management: Always combine signals with proper risk management, such as stop-loss orders, as STOP/STRONG STOP signals are not guaranteed exit points.
Backtesting: Before trading, backtest the indicator on historical data to evaluate performance with your strategy.
Customization: Adjust score weights (e.g., scoreSMA50AbovePrice) or Bayesian conditions to align with specific assets or market conditions.
Why This Indicator?
The IQ Trader's Technical Scoring System SS stands out for its blend of traditional and advanced analytics. The Bayesian trend analysis adds a probabilistic layer to decision-making, while the dynamic scoring system ensures signals are context-aware (above/below SMA50). Whether you're a swing trader, day trader, or risk-conscious investor, this indicator offers actionable insights with customizable controls.
Feedback Welcome: Share your experience or suggestions in the comments to help improve this tool for the TradingView community!

MCumulativeDelta* MCumulativeDelta Indicator *
The MCumulativeDelta Indicator shows the Buying / Selling pressure that is happening in the market. The Delta is powered by the *MBox Precision Delta* Algorithm. This indicator serves to show overall Accumulation and Distribution of the BUYERS and the SELLERS. It becomes possible to gauge if the market is overall Bullish or Bearish. This helps determine trade direction and keeping out of other trades that are counter to what the overall Buying / Selling is showing.
* WHAT THE SCRIPT DOES *
The script draws a histogram that can either be positive or negative. When the histogram is positive it means there are more Buyers in the Market. When the histogram is negative it means there are more sellers in the market. The more positive the histogram gets, the more BUYERS are flooding the market. The more negative the histogram gets, the more SELLERS are flooding the market. When the histogram switches over from negative to positive it is a Bullish sign of Buying. When the histogram switches over from positive to negative, it is a Bearish sign of Selling.
* HOW TO USE IT *
As the histogram becomes more negative, this shows that the SELLERS have taken control of the markets. Conversely, as the histogram becomes more positive, this shows that the Buyers have taken control of the markets. The side that is in control is the direction to generally place trades in, and at the same time filter out trades of the opposite direction.
* HOW IT WORKS *
The MCumulativeDelta histogram on the chart represents overall Buying / Selling. This is the DELTA (difference) between the BUYING and the SELLING. Taking the total BUYING and subtracting the total of SELLING, we produce the DELTA (difference) between the Buying / Selling and this is what is drawn by the histogram.
Unlike other Cumulative Delta indicators which determine delta from the Up / Down wick and just multiply by volume (not a true delta), the MCumulativeDelta indicator uses a sophisticated algorithm that analyzes price movement corresponding to volume movement.
The way the DELTA, BUYING, and SELLING is calculated is computed by the *MBox Precision Delta* Algorithm. The algorithm considers the following data points when making it's computation
1. Price moving up on increasing volume
2. Price moving up on decreasing volume
3. Price moving horizontally on increasing volume
4. Price moving horizontally on decreasing volume
5. Price moving down on increasing volume
6. Price moving down on decreasing volume
Using these data points allows MCumulativeDelta to effectively compute and define the following scenarios
1. Accumulation / Distribution
2. Buying / Selling Exhaustion
3. Buying / Selling EFFORT / NO RESULT
Once the scenario is determined, it will greatly aid in trade decision making. These scenarios are explained in the examples below
* EXAMPLE AND USE CASES *
- Accumulation Example -
When you see a large amount of BUYING (large positive histogram) and price entering an up trend, this is indicative of Accumulation and you would be looking for PULLBACKS to get into the up trend move.
- Distribution Example -
When you see a large amount of SELLING (large negative histogram) and price entering a down trend, this is indicative of Distribution and you would be looking for pullbacks to get into the down trend move.
- Buying EXHAUSTION Divergence -
As price makes higher highs, but the MCumulativeDelta histogram drops (becomes less positive) on the higher highs, it means BUYERS are exhausted. Potentially a reversal or change in behavior in the markets.
- Selling EXHAUSTION Divergence -
As price makes lower lows, but the MCumulativeDelta histogram contracts (becomes less negative) on the lower lows, it means SELLERS are exhausted. Potentially a reversal or change in behavior in the markets.
- BUYING EFFORT / NO RESULT -
As the MCumulativeDelta histogram increases positively, but price fails to make higher highs, it is a sign of EFFORT / NO RESULT on behalf of the Buyers. In this case Buyers are pushing hard to move price up, but are unable to, due to being OVERBOUGHT. If this is accompanied by visible SELLING, it would be a good short entry.
- SELLING EFFORT / NO RESULT -
As the MCumulativeDelta histogram increases negatively, but price fails to make lower lows, it is a sign of EFFORT / NO RESULT on behalf of the Sellers. In this case Sellers are pushing hard to move price down, but are unable to, due to being OVERSOLD. If this is accompanied by visible BUYING, it would be a good long entry.
* SETTING ALERTS *
- FOR CROSSING FROM BUYING TO SELLING OR SELLING TO BUYING -
To be alerted when the histogram crosses over from Buying to Selling (Positive to Negative) or Selling to Buying (Negative to Positive)
1. Right Click Chart -> Add Alert...
2. Select Condition to be "MCumulativeDelta"
3. Select "Crossing" with Value = 0
4. Options set "Once Per Bar Close"
5. Customize Any other Alert Options you want
* AUTHOR *
This script is published by MBoxWave LLC
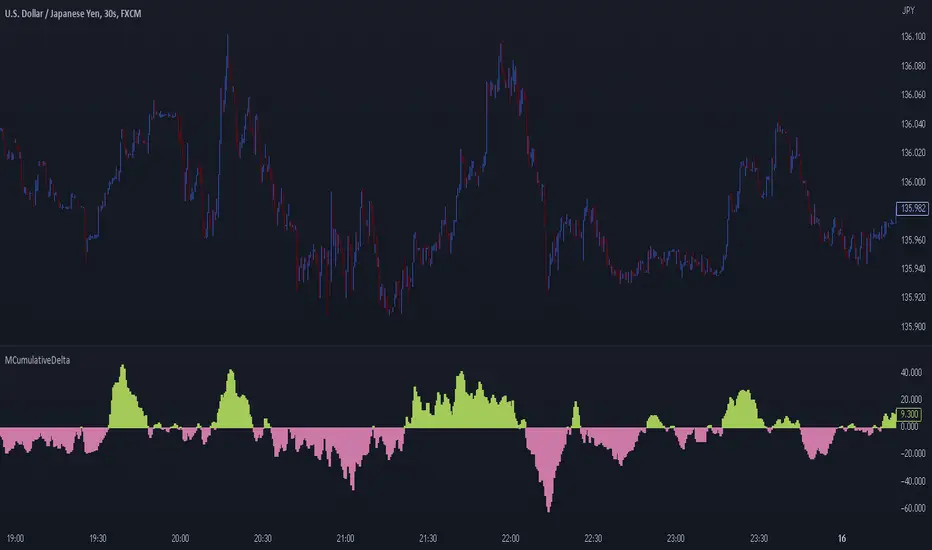
RSI Analytic Volume Matrix [RAVM] Overview
RSI Analytic Volume Matrix is an overlay indicator that turns classic RSI into a multi-layered market-reading engine. Instead of treating RSI 30 and 70 as simple buy/sell lines, RAVM combines RSI geometry (angle and acceleration), statistical volume analysis, and a 5×5 VSA-inspired matrix to describe what is really happening inside each candle.
The script is designed as an educational and analytical tool. It does not generate trading signals. Instead, it helps you read the market context, understand where the pressure is coming from (buyers vs. sellers), and see how price, momentum, and volume interact in real time.
Concept & Philosophy
RAVM is built around a hierarchical logic and a few core ideas:
• Hierarchical State Machine: First, RSI defines a context (where we are in the 0–100 range). Then the geometric engine evaluates the angle-of-turn of RSI using a Z-Score. Only after a meaningful geometric event is detected does the system promote a bar to a potential setup (warning vs. confirmed).
• Geometric Primacy: The angle and acceleration of RSI (RSI geometry) are more important than the raw RSI level itself. RAVM uses a geometric veto: if the geometric trigger is not confirmed, the confidence score is capped below 50%, even if volume looks interesting.
• RSI Beyond 30 and 70: Being above 70 or below 30 is not treated as an automatic overbought/oversold signal. RAVM treats those zones as contextual factors that contribute only a partial portion of the final score, alongside geometry, total volume expansion, buy/sell balance, and delta power.
• Volume Decomposition: Volume is decomposed into total, buy-side, sell-side, and delta components. Each of these is normalized with a Z-Score over a shared statistical window, so RSI geometry and volume live in the same statistical context.
• Educational Scoring Pipeline: RAVM builds a 0–100 "Quantum Score" for each detected setup. The score expresses how strong the story is across four dimensions: geometry (RSI angle-of-turn), total volume expansion, which side is driving that volume (buyers vs. sellers), and the power of delta. The score is designed for learning and weighting, not for mechanical trade entries.
• VSA Matrix Engine: A 5×5 matrix combines momentum states and volume dynamics. Each cell corresponds to an interpreted VSA-style scenario (Absorption, Distribution, No Demand, Stopping Volume, Strong Reversal, etc.), shown both as text and as a heatmap dashboard on the chart.
How RAVM Works
1. RSI Context & Geometry
RAVM starts with a classic RSI, but it does not stop at simple level checks. It computes the velocity and acceleration of RSI and normalizes them via a Z-Score to produce an Angle-of-Turn metric (Z-AoT). This Z-AoT is then mapped into a 0–1 intensity value called MSI (Momentum Shift Intensity).
The script monitors both classic RSI zones (around 30 and 70) and geometric triggers. Entering the lower or upper zone is treated as a contextual event only. A setup becomes "confirmed" when a significant geometric turn is detected (based on Z-AoT thresholds). Otherwise, the bar is at most a warning.
2. Volume & Statistical Engine
The volume engine can work in two modes: a geometric approximation (based on candle structure) or a more precise intrabar mode using up/down volume requests. In both cases, RAVM builds a volume packet consisting of:
• Total volume
• Buy-side volume
• Sell-side volume
• Delta (buy – sell)
Each of these series is normalized using a Z-Score over the same statistical window that is used for RSI geometry. This allows RAVM to answer questions such as: Is total volume exceptional on this bar? Is the expansion mostly coming from buyers or from sellers? Is delta unusually strong or weak compared to recent history?
3. Scoring System (Quantum Score)
For each bar where a setup is active, RAVM computes a 0–100 score intended as an educational confidence measure. The scoring pipeline follows this sequence:
A. RSI Geometry (MSI): Measures the strength of the RSI angle-of-turn via Z-AoT. This has geometric primacy over simple level checks.
B. RSI Zone Context: Being below 30 or above 70 contributes only a partial bonus to the score, reflecting the idea that these zones are context, not automatic signals. Mildly supportive zones (e.g., RSI below 50 for bullish contexts) can also contribute with lower weight.
C. Total Volume Expansion: A normalized Volume Power term expresses how exceptional the total volume is relative to its recent distribution. If there is no meaningful volume expansion, the score remains modest even if RSI geometry looks interesting.
D. Which Side Is Driving the Volume: RAVM then checks whether the expansion is primarily on the buy side or the sell side, using Z-Score statistics for buy and sell volume separately. This stage does not yet rely on delta as a power metric; it simply answers the question: "Is this expansion mostly driven by buyers, sellers, or both?"
E. Delta as Final Power: Only at the final stage does the script bring in delta and its Z-Score as a measure of how one-sided the pressure really is. A strong negative delta during a bullish context, for example, can highlight absorption, while a strong positive delta against a bearish context can highlight distribution or a buying climax.
If a setup is not geometrically confirmed (for example, a simple entry into RSI 30/70 without a strong geometric turn), RAVM caps the final score below 50%. This "Geometric Veto" enforces the idea that RSI geometry must confirm before a scenario can be considered high-confidence.
4. Overlay UI & Smart Labels
RAVM is an overlay indicator: all information is drawn directly on the price chart, not in a separate pane. When a setup is active, a smart label is attached to the bar, together with a vertical connector line. Each label shows:
• Direction of the setup (bullish or bearish)
• Trigger type (classic OS/OB vs. geometric/hidden)
• Status (warning vs. confirmed)
• Quantum Score as a percentage
Confirmed setups use stronger colors and solid connectors, while warnings use softer colors and dotted connectors. The script also manages label placement to avoid overlap, keeping the chart clean and readable.
In addition to labels, a dashboard table is drawn on the chart. It displays the currently active matrix scenario, the dominant bias, a short textual interpretation, the full 5×5 heatmap, and summary metrics such as RSI, MSI, and Volume Power.
RSI Is Not Just 30 and 70
One of the central design decisions in RAVM is to treat RSI 30 and 70 as context, not as fixed buy/sell buttons. Many traders mechanically assume that RSI below 30 means "buy" and RSI above 70 means "sell". RAVM explicitly rejects this simplification.
Instead, the script asks a series of deeper questions: How sharp is the angle-of-turn of RSI right now? Is total volume expanding or contracting? Is that expansion dominated by buyers or sellers? Is delta confirming the move, or is there a hidden absorption or distribution taking place?
In the scoring logic, being in a lower or upper RSI zone contributes only part of the final score. Geometry, volume expansion, the buy/sell split, and delta power all have to align before a high-confidence scenario emerges. This makes RAVM much closer to a structured market-reading tool than a classic overbought/oversold indicator.
Matrix User Manual – Reading the 5×5 Grid
The heart of RAVM is its 5×5 matrix, where the vertical axis represents momentum states (M1–M5) and the horizontal axis represents volume dynamics (V1–V5). Each cell in this grid corresponds to a VSA-style scenario. The dashboard highlights the currently active cell and prints a textual description so you can read the story at a glance.
1. Confirmation Scenarios
These scenarios occur when momentum direction and volume expansion are aligned:
• Bullish Confirmation / Strong Reversal: Momentum is shifting strongly upward (often from a depressed RSI context), and expanded volume is driven mainly by buyers. Often seen as a strong bullish reversal or continuation signal from a VSA perspective.
• Bearish Confirmation / Strong Drop: Momentum is turning decisively downward, and expanded volume is driven mainly by sellers. This maps to strong bearish continuation or sharp reversal patterns.
2. Absorption & Stopping Volume
• Absorption: Total volume expands, but the dominant flow is opposite to the recent price move or the geometric bias. For example, heavy selling volume while the geometric context is bullish. This can indicate smart money quietly absorbing orders from the crowd.
• Stopping Volume: Exceptionally high volume appears near the end of an extended move, while momentum begins to decelerate. Price may still print new extremes, but the effort vs. result relationship signals potential exhaustion and the possibility of a turn.
3. Distribution & Buying Climax
• Distribution: Heavy buying volume appears within a bearish or topping context. Rather than healthy accumulation, this often represents larger players offloading inventory to late buyers. The matrix will typically flag this as a bearish-leaning scenario despite strong upside prints.
• Buying Climax: A surge of buy-side volume near the end of a strong uptrend, with momentum starting to weaken. From a VSA point of view, this is often the last push where retail aggressively buys what smart money is selling.
4. No Demand & No Supply
• No Demand: Price attempts to rise but does so on low, non-expansive volume. The market is not interested in following the move, and the lack of participation often precedes weakness or sideways action.
• No Supply: Price tries to push lower on thin volume. Selling pressure is limited, and the lack of supply can precede stabilization or recovery if buyers step back in.
5. Trend Exhaustion
• Uptrend Exhaustion: Momentum remains nominally bullish, but the quality of volume deteriorates (e.g., more effort, less net result). The matrix marks this as an uptrend losing internal strength, often after a series of aggressive moves.
• Downtrend Exhaustion: Similar logic in the opposite direction: strong prior downtrend, but increasingly inefficient downside progress relative to the volume invested. This can precede accumulation or a relief rally.
6. Effort vs. Result Scenarios
• Bullish Effort, Little Result: Buyers invest notable volume, but price progress is limited. This may reveal hidden selling into strength or a lack of follow-through from the broader market.
• Bearish Effort, Little Result: Sellers push volume, but price does not decline proportionally. This can indicate absorption of selling pressure and potential underlying demand.
7. Neutral, Churn & Thin Markets
• Neutral / Thin Market: Momentum and volume both remain muted. RAVM marks these as neutral cells where aggressive decision-making is usually less attractive and observing the broader structure is more important.
• High Volume Churn / Volatility: Both sides are active with high volume but limited directional progress. This can correspond to battle zones, local ranges, or high volatility rotations where the main message is conflict rather than clear trend.
Inputs & Options
RAVM includes several input groups to adapt the tool to your preferences:
• Localization: Multiple language options for all labels and dashboard text (e.g., English, Farsi, Turkish, Russian).
• RSI Core Settings: RSI length, source, and upper/lower contextual zones (typically around 30 and 70).
• Geometric Engine: Z-AoT sigma thresholds, confirmation ratios, and normalization window multiplier. These control how sensitive the script is to RSI angle-of-turn events.
• Volume Engine: Choice between geometric approximation and intrabar up/down volume, Z-Score thresholds for volume expansion, and related parameters.
• Visual Interface: Toggles for smart labels, dashboard table, font sizes, dashboard position, and color themes for bullish, bearish, and warning states.
Disclaimer
RSI Analytic Volume Matrix is provided for educational and research purposes only. It does not constitute financial advice and is not a signal generator. Any trading decisions you make based on this tool, or any other, are entirely your own responsibility. Always consider your own risk management rules and conduct your own analysis.

RED-E Institutional Flow Tracker ProRED-E Institutional Flow Tracker Pro
A histogram-based institutional activity detector for swing traders and options traders. Identifies institutional buying/selling pressure through volume analysis, money flow calculations, and manipulation detection algorithms.
═══════════════════════════════════════════════════════════════════════════════
OVERVIEW
═══════════════════════════════════════════════════════════════════════════════
This indicator addresses two critical challenges in swing trading:
1. Exiting profitable positions prematurely due to normal market volatility
2. Holding positions during periods of market manipulation
The histogram display provides clear visual signals (BUY/HOLD/SELL) with educational tooltips explaining why each signal appeared and how to trade it.
═══════════════════════════════════════════════════════════════════════════════
ORIGINALITY & METHODOLOGY
═══════════════════════════════════════════════════════════════════════════════
Built from scratch using Pine Script v6, this indicator combines multiple analytical methods into a unified histogram system:
**Core Detection Methods:**
- **Dollar Volume Analysis** - Multiplies price by volume to identify institutional-sized trades. Default threshold: 3x average dollar volume over 20 periods.
- **Smart Money Flow Detection** - Combines three simultaneous conditions: unusual volume (1.5x+ average), large order size (3x+ average dollar volume), and directional price movement. All three must occur on the same bar for confirmation.
- **Money Flow Index Integration** - 14-period volume-weighted momentum indicator. Calculated as: typical price (HLC3) × volume, separated into positive flow (up bars) and negative flow (down bars), converted to 0-100 scale.
- **Manipulation Detection Algorithm** - Identifies suspicious patterns where volume spikes dramatically (>1.5x threshold) but price moves minimally (<0.5% volatility). This pattern is characteristic of spoofing, layering, and wash trading.
- **Market Regime Classification** - Uses Money Flow Index combined with flow strength to classify market state as Bullish (MFI >50 and positive flow), Bearish (MFI <50 and negative flow), or Neutral.
**Histogram Calculation:**
Formula: (Price Change % × Volume Ratio) × (1.5x multiplier if large order detected)
Smoothed with 3-period EMA for clean visualization
Values automatically scaled for optimal display
**21-Period Moving Average:**
Simple moving average of histogram values provides trend direction confirmation. Crossovers signal momentum shifts.
═══════════════════════════════════════════════════════════════════════════════
HOW IT WORKS - TECHNICAL DETAILS
═══════════════════════════════════════════════════════════════════════════════
**1. Volume Analysis Foundation**
- 50-period SMA of volume establishes baseline
- Current volume compared to baseline creates Volume Ratio
- Unusual volume threshold (default 1.5x) flags institutional interest
**2. Money Flow Index (14-period default)**
- Typical price = (High + Low + Close) / 3
- Raw Money Flow = Typical Price × Volume
- Positive Flow = Raw Money Flow when price up
- Negative Flow = Raw Money Flow when price down
- MFI = 100 -
**3. Large Order Detection**
- Dollar Volume = Close Price × Volume
- 20-period average establishes baseline
- Orders exceeding 3x baseline flagged as institutional
**4. Smart Money Logic**
- Buying Signal: Positive price change AND large order AND volume >1.5x average (all simultaneous)
- Selling Signal: Negative price change AND large order AND volume >1.5x average (all simultaneous)
- Must occur on same bar for confirmation
**5. Flow Magnitude Tracking**
- Dollar volume tracked cumulatively
- Automatically resets daily at market open
- Formatted in readable units: K (thousands), M (millions), B (billions), T (trillions)
- Displayed in dashboard for easy monitoring
**6. Signal Classification**
- Strong Buy: Histogram >0.3 AND bullish regime AND unusual volume
- Buy: Histogram >0.15 AND bullish regime
- Hold: Histogram between ±0.15 OR neutral regime
- Sell: Histogram <-0.15 AND bearish regime
- Strong Sell: Histogram <-0.3 AND bearish regime AND unusual volume
**7. Manipulation Detection**
- Triggers when: Volume Ratio > threshold AND price volatility < 0.5%
- This pattern suggests large volume without corresponding price impact
- Common in spoofing (fake orders), layering (multiple false orders), and wash trading
═══════════════════════════════════════════════════════════════════════════════
HISTOGRAM DISPLAY & INTERPRETATION
═══════════════════════════════════════════════════════════════════════════════
**Color-Coded Bars:**
- **Bright Green** - Strong institutional buying (>0.3 momentum + bullish regime + unusual volume)
- **Light Green** - Institutional buying (>0.15 momentum + bullish regime)
- **Gray** - Neutral/Hold zone (±0.15 momentum or neutral regime)
- **Light Red** - Institutional selling (<-0.15 momentum + bearish regime)
- **Bright Red** - Strong institutional selling (<-0.3 momentum + bearish regime + unusual volume)
**Visual Signals:**
- **BUY labels** - Appear above bright green bars with detailed tooltip
- **SELL labels** - Appear below bright red bars with detailed tooltip
- **HOLD labels** - Appear on most recent bar during consolidation with educational tooltip
- **Yellow warning dots (⚠)** - Mark manipulation periods at zero line with explanation tooltip
- **Blue 21-period MA** - Shows overall trend direction
**Interactive Tooltips:**
Hover over any signal to see:
- Why the signal appeared (exact metrics)
- What the data shows (momentum, MFI, volume values)
- How to trade it (entry, exit, position sizing)
- Risk management recommendations
**Plot Style Options:**
Users can choose from 5 display styles:
- Columns (default) - Traditional histogram bars
- Area - Filled area chart
- Line - Simple line chart
- Step Line - Step-style line
- Histogram - Alternative histogram style
═══════════════════════════════════════════════════════════════════════════════
DASHBOARD METRICS EXPLAINED
═══════════════════════════════════════════════════════════════════════════════
12-row real-time dashboard displays:
**Current Flow** - Institutional money flow for current bar (M/B/T units)
**Daily Flow** - Cumulative activity since market open (resets daily)
**Flow Strength** - Intensity percentage (0-100%)
- >70% = Extreme pressure
- 40-70% = Moderate activity
- <40% = Weak/absent activity
**Money Flow Index** - Volume-weighted momentum (0-100 scale)
- >60 = Strong buying pressure
- 40-60 = Neutral/mixed
- <40 = Strong selling pressure
**Volume Ratio** - Current vs 50-day average
- >2.0x = Highly unusual
- 1.5-2.0x = Unusual
- <1.5x = Normal
**Market Regime** - Current classification
- Bullish: MFI >50 AND histogram >0
- Bearish: MFI <50 AND histogram <0
- Neutral: All other conditions
**Activity Status** - Real-time assessment
- HEAVY BUYING: Unusual volume + buying + MFI >60
- BUYING: Large orders + positive movement
- HEAVY SELLING: Unusual volume + selling + MFI <40
- SELLING: Large orders + negative movement
- NEUTRAL: No significant activity
**Unusual Volume** - Binary alert when exceeds threshold
**Large Orders** - Binary alert when dollar volume >3x average
**Manipulation Warning** - Binary alert for suspicious patterns
**Swing Signal** - Primary recommendation
- HOLD LONG: Bullish regime + Flow Strength >60%
- HOLD SHORT: Bearish regime + Flow Strength >60%
- CAUTION: Manipulation detected
- MONITOR: All other conditions
═══════════════════════════════════════════════════════════════════════════════
HOW TO USE FOR SWING TRADING
═══════════════════════════════════════════════════════════════════════════════
**ENTRY CONFIRMATION (Long Positions):**
Wait for multiple confirmations:
1. Histogram shows bright green bars
2. Histogram crosses above 21-period MA
3. Flow Strength >60%
4. Dashboard shows "BUYING" or "HEAVY BUYING"
5. Volume Ratio >1.5x
6. No yellow manipulation warnings
7. Regime shows "BULLISH"
**HOLDING POSITIONS (Primary Use Case):**
The indicator's strength is helping traders stay in winning trades. Continue holding when:
- Dashboard displays "HOLD LONG" or "HOLD SHORT"
- Histogram bars remain same color as position direction
- Histogram stays on correct side of 21-period MA
- Daily Flow continues trending in your direction
- Market regime supports position
- No "CAUTION" signals appear
This prevents premature exits during normal volatility when institutions are still supporting the move.
**EXIT SIGNALS:**
Consider closing positions when:
- Histogram crosses 21-period MA against position
- Histogram color changes from green to red (or vice versa)
- Dashboard changes to "CAUTION"
- Yellow manipulation warnings appear
- Market regime flips
- Flow Strength drops below 40%
**ENTRY CONFIRMATION (Short Positions):**
Wait for multiple confirmations:
1. Histogram shows bright red bars
2. Histogram crosses below 21-period MA
3. Flow Strength >60%
4. Dashboard shows "SELLING" or "HEAVY SELLING"
5. Volume Ratio >1.5x
6. No manipulation warnings
7. Regime shows "BEARISH"
═══════════════════════════════════════════════════════════════════════════════
CUSTOMIZATION OPTIONS
═══════════════════════════════════════════════════════════════════════════════
**Flow Detection Settings:**
- Unusual Volume Threshold (1.0-5.0x, default 1.5x)
- Large Order Multiplier (2.0-10.0x, default 3.0x)
- Flow Analysis Period (5-50 bars, default 14)
**Histogram Display:**
- Histogram Style (5 options: Columns/Area/Line/Step/Histogram)
- Histogram Width (1-10, default 4)
**Moving Average:**
- Show 21-Period MA (toggle)
- MA Line Color (customizable)
- MA Line Width (1-5, default 2)
**Visual Settings:**
- Show Buy/Hold/Sell Labels (toggle)
- Label Size (Tiny/Small/Normal/Large/Huge)
- Label Distance from Bars (0.1-2.0x, prevents overlap)
- Show Manipulation Warnings (toggle)
- Show Watermark (toggle)
**Dashboard:**
- Position (4 corners)
- Size (Small/Normal/Large)
- Background Color (fully customizable)
- Border Color (fully customizable)
**Alerts:**
- Toggle institutional activity alerts
- Three types: Strong Buy, Strong Sell, Manipulation Detection
═══════════════════════════════════════════════════════════════════════════════
RECOMMENDED SETTINGS BY TRADING STYLE
═══════════════════════════════════════════════════════════════════════════════
**Day Trading (15min-1H):**
- Volume Threshold: 1.3x
- Large Order Multiplier: 2.5x
- Flow Period: 7-10
- Label Distance: 0.3-0.4x
**Swing Trading (4H-Daily) - DEFAULT:**
- Volume Threshold: 1.5x
- Large Order Multiplier: 3.0x
- Flow Period: 14
- Label Distance: 0.5x
**Position Trading (Daily-Weekly):**
- Volume Threshold: 2.0x
- Large Order Multiplier: 5.0x
- Flow Period: 21
- Label Distance: 0.7-1.0x
═══════════════════════════════════════════════════════════════════════════════
BEST MARKETS & TIMEFRAMES
═══════════════════════════════════════════════════════════════════════════════
**Optimal Performance:**
- Timeframes: 1-hour, 4-hour, Daily
- Markets: Liquid stocks and ETFs (avg volume >1M shares/day)
- Market Cap: >$500M (ensures institutional participation)
- Examples: SPY, QQQ, AAPL, MSFT, NVDA, TSLA, major sector ETFs
**Less Effective:**
- Penny stocks (<$500M market cap)
- Low-volume securities
- Cryptocurrency (different volume dynamics)
- Timeframes below 15 minutes (excessive noise)
═══════════════════════════════════════════════════════════════════════════════
EDUCATIONAL FEATURES
═══════════════════════════════════════════════════════════════════════════════
**Interactive Learning:**
Every signal includes a hover tooltip that explains:
- **Why** - The specific conditions that triggered the signal
- **What** - The exact metric values (momentum, MFI, volume)
- **How** - Specific trading actions to take
- **When** - Exit conditions to monitor
- **Risk** - Management recommendations
**Example Tooltips:**
**BUY Signal:** "Institutions actively accumulating. Momentum: X.XX | MFI: XX | Volume: X.Xx avg. Large orders detected. Consider LONG positions or CALL options. Place stops below support."
**HOLD Signal:** "Consolidation phase. No clear direction. HOLD profitable positions. DO NOT enter new trades. Many traders exit too early during consolidation - institutions accumulate before next move."
**Manipulation Warning:** "High volume with minimal price movement. Possible spoofing, layering, or wash trading. STAY OUT. Tighten stops. Expect whipsaw. Wait for warning to clear."
═══════════════════════════════════════════════════════════════════════════════
LIMITATIONS & DISCLOSURES
═══════════════════════════════════════════════════════════════════════════════
**What This Indicator DOES:**
✓ Analyzes publicly available price and volume data
✓ Identifies patterns consistent with institutional activity
✓ Detects suspicious volume/price relationships
✓ Provides statistical money flow analysis
✓ Helps traders hold through normal volatility
**What This Indicator DOES NOT DO:**
✗ Access external APIs or institutional order flow data
✗ Track actual institutional orders (infers from patterns)
✗ Guarantee profitable trades
✗ Replace risk management
✗ Work reliably on illiquid securities
✗ Provide financial advice
**Technical Limitations:**
- Uses confirmed bar data only (no repainting)
- Requires minimum 50 bars for volume baseline
- Daily Flow resets at market open
- Manipulation detection can have false positives during low liquidity
- Label positioning may overlap on extreme values
**Trading Disclaimers:**
- Infers institutional activity through statistical analysis
- Should complement, not replace, fundamental analysis
- Past performance does not guarantee future results
- Always use proper position sizing and stop losses
- Not a registered investment advisor
**Risk Warning:**
Options trading carries substantial risk. This indicator is provided for educational purposes. Users should conduct due diligence and consult licensed professionals before trading.
═══════════════════════════════════════════════════════════════════════════════
ALERT CONDITIONS
═══════════════════════════════════════════════════════════════════════════════
Three built-in alert types:
1. **Strong Buy Signal** - Bright green bars appear (>0.3 momentum + bullish regime + unusual volume)
2. **Strong Sell Signal** - Bright red bars appear (<-0.3 momentum + bearish regime + unusual volume)
3. **Manipulation Detected** - Suspicious volume/price patterns occur
To enable:
- Click three dots next to indicator name
- Select "Create Alert"
- Choose alert condition
- Configure notifications
- Set frequency to "Once Per Bar Close"
═══════════════════════════════════════════════════════════════════════════════
TECHNICAL SPECIFICATIONS
═══════════════════════════════════════════════════════════════════════════════
- **Pine Script Version:** v6
- **Type:** Oscillator (separate pane)
- **Repainting:** None - uses confirmed bar data only
- **Lookahead Bias:** None
- **Max Bars Back:** 500
- **Computational Load:** Low to moderate
- **Bar Replay Compatible:** Yes
═══════════════════════════════════════════════════════════════════════════════
VERSION HISTORY
═══════════════════════════════════════════════════════════════════════════════
**v1.0** (Initial Release)
- Histogram-based institutional momentum display
- 5 customizable plot styles
- 12-metric comprehensive dashboard
- Flow magnitude tracking (M/B/T units)
- 21-period moving average overlay
- Manipulation detection algorithm
- Educational tooltip system on all signals
- BUY/HOLD/SELL label system with positioning
- Market regime classification
- Three alert conditions
- Fully customizable dashboard (size, colors, position)
═══════════════════════════════════════════════════════════════════════════════
CREDITS
═══════════════════════════════════════════════════════════════════════════════
Developed from scratch using Pine Script v6 and standard TradingView built-in functions. No code copied from other scripts. Methodology combines classical volume analysis with modern institutional flow detection.
═══════════════════════════════════════════════════════════════════════════════
This indicator helps swing traders answer: "Should I hold or exit?" By analyzing institutional activity and warning of manipulation, it provides the framework to stay in winning trades while protecting against adverse conditions.
Published open-source to contribute to the TradingView community.
Questions or feedback? Leave a comment below.
═══════════════════════════════════════════════════════════════════════════════
Disclaimer: Provided "as-is" without warranty. Use at your own risk. Past performance does not guarantee future results.

ATAI Volume analysis with price action V 1.00ATAI Volume Analysis with Price Action
1. Introduction
1.1 Overview
ATAI Volume Analysis with Price Action is a composite indicator designed for TradingView. It combines per‑side volume data —that is, how much buying and selling occurs during each bar—with standard price‑structure elements such as swings, trend lines and support/resistance. By blending these elements the script aims to help a trader understand which side is in control, whether a breakout is genuine, when markets are potentially exhausted and where liquidity providers might be active.
The indicator is built around TradingView’s up/down volume feed accessed via the TradingView/ta/10 library. The following excerpt from the script illustrates how this feed is configured:
import TradingView/ta/10 as tvta
// Determine lower timeframe string based on user choice and chart resolution
string lower_tf_breakout = use_custom_tf_input ? custom_tf_input :
timeframe.isseconds ? "1S" :
timeframe.isintraday ? "1" :
timeframe.isdaily ? "5" : "60"
// Request up/down volume (both positive)
= tvta.requestUpAndDownVolume(lower_tf_breakout)
Lower‑timeframe selection. If you do not specify a custom lower timeframe, the script chooses a default based on your chart resolution: 1 second for second charts, 1 minute for intraday charts, 5 minutes for daily charts and 60 minutes for anything longer. Smaller intervals provide a more precise view of buyer and seller flow but cover fewer bars. Larger intervals cover more history at the cost of granularity.
Tick vs. time bars. Many trading platforms offer a tick / intrabar calculation mode that updates an indicator on every trade rather than only on bar close. Turning on one‑tick calculation will give the most accurate split between buy and sell volume on the current bar, but it typically reduces the amount of historical data available. For the highest fidelity in live trading you can enable this mode; for studying longer histories you might prefer to disable it. When volume data is completely unavailable (some instruments and crypto pairs), all modules that rely on it will remain silent and only the price‑structure backbone will operate.
Figure caption, Each panel shows the indicator’s info table for a different volume sampling interval. In the left chart, the parentheses “(5)” beside the buy‑volume figure denote that the script is aggregating volume over five‑minute bars; the center chart uses “(1)” for one‑minute bars; and the right chart uses “(1T)” for a one‑tick interval. These notations tell you which lower timeframe is driving the volume calculations. Shorter intervals such as 1 minute or 1 tick provide finer detail on buyer and seller flow, but they cover fewer bars; longer intervals like five‑minute bars smooth the data and give more history.
Figure caption, The values in parentheses inside the info table come directly from the Breakout — Settings. The first row shows the custom lower-timeframe used for volume calculations (e.g., “(1)”, “(5)”, or “(1T)”)
2. Price‑Structure Backbone
Even without volume, the indicator draws structural features that underpin all other modules. These features are always on and serve as the reference levels for subsequent calculations.
2.1 What it draws
• Pivots: Swing highs and lows are detected using the pivot_left_input and pivot_right_input settings. A pivot high is identified when the high recorded pivot_right_input bars ago exceeds the highs of the preceding pivot_left_input bars and is also higher than (or equal to) the highs of the subsequent pivot_right_input bars; pivot lows follow the inverse logic. The indicator retains only a fixed number of such pivot points per side, as defined by point_count_input, discarding the oldest ones when the limit is exceeded.
• Trend lines: For each side, the indicator connects the earliest stored pivot and the most recent pivot (oldest high to newest high, and oldest low to newest low). When a new pivot is added or an old one drops out of the lookback window, the line’s endpoints—and therefore its slope—are recalculated accordingly.
• Horizontal support/resistance: The highest high and lowest low within the lookback window defined by length_input are plotted as horizontal dashed lines. These serve as short‑term support and resistance levels.
• Ranked labels: If showPivotLabels is enabled the indicator prints labels such as “HH1”, “HH2”, “LL1” and “LL2” near each pivot. The ranking is determined by comparing the price of each stored pivot: HH1 is the highest high, HH2 is the second highest, and so on; LL1 is the lowest low, LL2 is the second lowest. In the case of equal prices the newer pivot gets the better rank. Labels are offset from price using ½ × ATR × label_atr_multiplier, with the ATR length defined by label_atr_len_input. A dotted connector links each label to the candle’s wick.
2.2 Key settings
• length_input: Window length for finding the highest and lowest values and for determining trend line endpoints. A larger value considers more history and will generate longer trend lines and S/R levels.
• pivot_left_input, pivot_right_input: Strictness of swing confirmation. Higher values require more bars on either side to form a pivot; lower values create more pivots but may include minor swings.
• point_count_input: How many pivots are kept in memory on each side. When new pivots exceed this number the oldest ones are discarded.
• label_atr_len_input and label_atr_multiplier: Determine how far pivot labels are offset from the bar using ATR. Increasing the multiplier moves labels further away from price.
• Styling inputs for trend lines, horizontal lines and labels (color, width and line style).
Figure caption, The chart illustrates how the indicator’s price‑structure backbone operates. In this daily example, the script scans for bars where the high (or low) pivot_right_input bars back is higher (or lower) than the preceding pivot_left_input bars and higher or lower than the subsequent pivot_right_input bars; only those bars are marked as pivots.
These pivot points are stored and ranked: the highest high is labelled “HH1”, the second‑highest “HH2”, and so on, while lows are marked “LL1”, “LL2”, etc. Each label is offset from the price by half of an ATR‑based distance to keep the chart clear, and a dotted connector links the label to the actual candle.
The red diagonal line connects the earliest and latest stored high pivots, and the green line does the same for low pivots; when a new pivot is added or an old one drops out of the lookback window, the end‑points and slopes adjust accordingly. Dashed horizontal lines mark the highest high and lowest low within the current lookback window, providing visual support and resistance levels. Together, these elements form the structural backbone that other modules reference, even when volume data is unavailable.
3. Breakout Module
3.1 Concept
This module confirms that a price break beyond a recent high or low is supported by a genuine shift in buying or selling pressure. It requires price to clear the highest high (“HH1”) or lowest low (“LL1”) and, simultaneously, that the winning side shows a significant volume spike, dominance and ranking. Only when all volume and price conditions pass is a breakout labelled.
3.2 Inputs
• lookback_break_input : This controls the number of bars used to compute moving averages and percentiles for volume. A larger value smooths the averages and percentiles but makes the indicator respond more slowly.
• vol_mult_input : The “spike” multiplier; the current buy or sell volume must be at least this multiple of its moving average over the lookback window to qualify as a breakout.
• rank_threshold_input (0–100) : Defines a volume percentile cutoff: the current buyer/seller volume must be in the top (100−threshold)%(100−threshold)% of all volumes within the lookback window. For example, if set to 80, the current volume must be in the top 20 % of the lookback distribution.
• ratio_threshold_input (0–1) : Specifies the minimum share of total volume that the buyer (for a bullish breakout) or seller (for bearish) must hold on the current bar; the code also requires that the cumulative buyer volume over the lookback window exceeds the seller volume (and vice versa for bearish cases).
• use_custom_tf_input / custom_tf_input : When enabled, these inputs override the automatic choice of lower timeframe for up/down volume; otherwise the script selects a sensible default based on the chart’s timeframe.
• Label appearance settings : Separate options control the ATR-based offset length, offset multiplier, label size and colors for bullish and bearish breakout labels, as well as the connector style and width.
3.3 Detection logic
1. Data preparation : Retrieve per‑side volume from the lower timeframe and take absolute values. Build rolling arrays of the last lookback_break_input values to compute simple moving averages (SMAs), cumulative sums and percentile ranks for buy and sell volume.
2. Volume spike: A spike is flagged when the current buy (or, in the bearish case, sell) volume is at least vol_mult_input times its SMA over the lookback window.
3. Dominance test: The buyer’s (or seller’s) share of total volume on the current bar must meet or exceed ratio_threshold_input. In addition, the cumulative sum of buyer volume over the window must exceed the cumulative sum of seller volume for a bullish breakout (and vice versa for bearish). A separate requirement checks the sign of delta: for bullish breakouts delta_breakout must be non‑negative; for bearish breakouts it must be non‑positive.
4. Percentile rank: The current volume must fall within the top (100 – rank_threshold_input) percent of the lookback distribution—ensuring that the spike is unusually large relative to recent history.
5. Price test: For a bullish signal, the closing price must close above the highest pivot (HH1); for a bearish signal, the close must be below the lowest pivot (LL1).
6. Labeling: When all conditions above are satisfied, the indicator prints “Breakout ↑” above the bar (bullish) or “Breakout ↓” below the bar (bearish). Labels are offset using half of an ATR‑based distance and linked to the candle with a dotted connector.
Figure caption, (Breakout ↑ example) , On this daily chart, price pushes above the red trendline and the highest prior pivot (HH1). The indicator recognizes this as a valid breakout because the buyer‑side volume on the lower timeframe spikes above its recent moving average and buyers dominate the volume statistics over the lookback period; when combined with a close above HH1, this satisfies the breakout conditions. The “Breakout ↑” label appears above the candle, and the info table highlights that up‑volume is elevated relative to its 11‑bar average, buyer share exceeds the dominance threshold and money‑flow metrics support the move.
Figure caption, In this daily example, price breaks below the lowest pivot (LL1) and the lower green trendline. The indicator identifies this as a bearish breakout because sell‑side volume is sharply elevated—about twice its 11‑bar average—and sellers dominate both the bar and the lookback window. With the close falling below LL1, the script triggers a Breakout ↓ label and marks the corresponding row in the info table, which shows strong down volume, negative delta and a seller share comfortably above the dominance threshold.
4. Market Phase Module (Volume Only)
4.1 Concept
Not all markets trend; many cycle between periods of accumulation (buying pressure building up), distribution (selling pressure dominating) and neutral behavior. This module classifies the current bar into one of these phases without using ATR , relying solely on buyer and seller volume statistics. It looks at net flows, ratio changes and an OBV‑like cumulative line with dual‑reference (1‑ and 2‑bar) trends. The result is displayed both as on‑chart labels and in a dedicated row of the info table.
4.2 Inputs
• phase_period_len: Number of bars over which to compute sums and ratios for phase detection.
• phase_ratio_thresh : Minimum buyer share (for accumulation) or minimum seller share (for distribution, derived as 1 − phase_ratio_thresh) of the total volume.
• strict_mode: When enabled, both the 1‑bar and 2‑bar changes in each statistic must agree on the direction (strict confirmation); when disabled, only one of the two references needs to agree (looser confirmation).
• Color customisation for info table cells and label styling for accumulation and distribution phases, including ATR length, multiplier, label size, colors and connector styles.
• show_phase_module: Toggles the entire phase detection subsystem.
• show_phase_labels: Controls whether on‑chart labels are drawn when accumulation or distribution is detected.
4.3 Detection logic
The module computes three families of statistics over the volume window defined by phase_period_len:
1. Net sum (buyers minus sellers): net_sum_phase = Σ(buy) − Σ(sell). A positive value indicates a predominance of buyers. The code also computes the differences between the current value and the values 1 and 2 bars ago (d_net_1, d_net_2) to derive up/down trends.
2. Buyer ratio: The instantaneous ratio TF_buy_breakout / TF_tot_breakout and the window ratio Σ(buy) / Σ(total). The current ratio must exceed phase_ratio_thresh for accumulation or fall below 1 − phase_ratio_thresh for distribution. The first and second differences of the window ratio (d_ratio_1, d_ratio_2) determine trend direction.
3. OBV‑like cumulative net flow: An on‑balance volume analogue obv_net_phase increments by TF_buy_breakout − TF_sell_breakout each bar. Its differences over the last 1 and 2 bars (d_obv_1, d_obv_2) provide trend clues.
The algorithm then combines these signals:
• For strict mode , accumulation requires: (a) current ratio ≥ threshold, (b) cumulative ratio ≥ threshold, (c) both ratio differences ≥ 0, (d) net sum differences ≥ 0, and (e) OBV differences ≥ 0. Distribution is the mirror case.
• For loose mode , it relaxes the directional tests: either the 1‑ or the 2‑bar difference needs to agree in each category.
If all conditions for accumulation are satisfied, the phase is labelled “Accumulation” ; if all conditions for distribution are satisfied, it’s labelled “Distribution” ; otherwise the phase is “Neutral” .
4.4 Outputs
• Info table row : Row 8 displays “Market Phase (Vol)” on the left and the detected phase (Accumulation, Distribution or Neutral) on the right. The text colour of both cells matches a user‑selectable palette (typically green for accumulation, red for distribution and grey for neutral).
• On‑chart labels : When show_phase_labels is enabled and a phase persists for at least one bar, the module prints a label above the bar ( “Accum” ) or below the bar ( “Dist” ) with a dashed or dotted connector. The label is offset using ATR based on phase_label_atr_len_input and phase_label_multiplier and is styled according to user preferences.
Figure caption, The chart displays a red “Dist” label above a particular bar, indicating that the accumulation/distribution module identified a distribution phase at that point. The detection is based on seller dominance: during that bar, the net buyer-minus-seller flow and the OBV‑style cumulative flow were trending down, and the buyer ratio had dropped below the preset threshold. These conditions satisfy the distribution criteria in strict mode. The label is placed above the bar using an ATR‑based offset and a dashed connector. By the time of the current bar in the screenshot, the phase indicator shows “Neutral” in the info table—signaling that neither accumulation nor distribution conditions are currently met—yet the historical “Dist” label remains to mark where the prior distribution phase began.
Figure caption, In this example the market phase module has signaled an Accumulation phase. Three bars before the current candle, the algorithm detected a shift toward buyers: up‑volume exceeded its moving average, down‑volume was below average, and the buyer share of total volume climbed above the threshold while the on‑balance net flow and cumulative ratios were trending upwards. The blue “Accum” label anchored below that bar marks the start of the phase; it remains on the chart because successive bars continue to satisfy the accumulation conditions. The info table confirms this: the “Market Phase (Vol)” row still reads Accumulation, and the ratio and sum rows show buyers dominating both on the current bar and across the lookback window.
5. OB/OS Spike Module
5.1 What overbought/oversold means here
In many markets, a rapid extension up or down is often followed by a period of consolidation or reversal. The indicator interprets overbought (OB) conditions as abnormally strong selling risk at or after a price rally and oversold (OS) conditions as unusually strong buying risk after a decline. Importantly, these are not direct trade signals; rather they flag areas where caution or contrarian setups may be appropriate.
5.2 Inputs
• minHits_obos (1–7): Minimum number of oscillators that must agree on an overbought or oversold condition for a label to print.
• syncWin_obos: Length of a small sliding window over which oscillator votes are smoothed by taking the maximum count observed. This helps filter out choppy signals.
• Volume spike criteria: kVolRatio_obos (ratio of current volume to its SMA) and zVolThr_obos (Z‑score threshold) across volLen_obos. Either threshold can trigger a spike.
• Oscillator toggles and periods: Each of RSI, Stochastic (K and D), Williams %R, CCI, MFI, DeMarker and Stochastic RSI can be independently enabled; their periods are adjustable.
• Label appearance: ATR‑based offset, size, colors for OB and OS labels, plus connector style and width.
5.3 Detection logic
1. Directional volume spikes: Volume spikes are computed separately for buyer and seller volumes. A sell volume spike (sellVolSpike) flags a potential OverBought bar, while a buy volume spike (buyVolSpike) flags a potential OverSold bar. A spike occurs when the respective volume exceeds kVolRatio_obos times its simple moving average over the window or when its Z‑score exceeds zVolThr_obos.
2. Oscillator votes: For each enabled oscillator, calculate its overbought and oversold state using standard thresholds (e.g., RSI ≥ 70 for OB and ≤ 30 for OS; Stochastic %K/%D ≥ 80 for OB and ≤ 20 for OS; etc.). Count how many oscillators vote for OB and how many vote for OS.
3. Minimum hits: Apply the smoothing window syncWin_obos to the vote counts using a maximum‑of‑last‑N approach. A candidate bar is only considered if the smoothed OB hit count ≥ minHits_obos (for OverBought) or the smoothed OS hit count ≥ minHits_obos (for OverSold).
4. Tie‑breaking: If both OverBought and OverSold spike conditions are present on the same bar, compare the smoothed hit counts: the side with the higher count is selected; ties default to OverBought.
5. Label printing: When conditions are met, the bar is labelled as “OverBought X/7” above the candle or “OverSold X/7” below it. “X” is the number of oscillators confirming, and the bracket lists the abbreviations of contributing oscillators. Labels are offset from price using half of an ATR‑scaled distance and can optionally include a dotted or dashed connector line.
Figure caption, In this chart the overbought/oversold module has flagged an OverSold signal. A sell‑off from the prior highs brought price down to the lower trend‑line, where the bar marked “OverSold 3/7 DeM” appears. This label indicates that on that bar the module detected a buy‑side volume spike and that at least three of the seven enabled oscillators—in this case including the DeMarker—were in oversold territory. The label is printed below the candle with a dotted connector, signaling that the market may be temporarily exhausted on the downside. After this oversold print, price begins to rebound towards the upper red trend‑line and higher pivot levels.
Figure caption, This example shows the overbought/oversold module in action. In the left‑hand panel you can see the OB/OS settings where each oscillator (RSI, Stochastic, Williams %R, CCI, MFI, DeMarker and Stochastic RSI) can be enabled or disabled, and the ATR length and label offset multiplier adjusted. On the chart itself, price has pushed up to the descending red trendline and triggered an “OverBought 3/7” label. That means the sell‑side volume spiked relative to its average and three out of the seven enabled oscillators were in overbought territory. The label is offset above the candle by half of an ATR and connected with a dashed line, signaling that upside momentum may be overextended and a pause or pullback could follow.
6. Buyer/Seller Trap Module
6.1 Concept
A bull trap occurs when price appears to break above resistance, attracting buyers, but fails to sustain the move and quickly reverses, leaving a long upper wick and trapping late entrants. A bear trap is the opposite: price breaks below support, lures in sellers, then snaps back, leaving a long lower wick and trapping shorts. This module detects such traps by looking for price structure sweeps, order‑flow mismatches and dominance reversals. It uses a scoring system to differentiate risk from confirmed traps.
6.2 Inputs
• trap_lookback_len: Window length used to rank extremes and detect sweeps.
• trap_wick_threshold: Minimum proportion of a bar’s range that must be wick (upper for bull traps, lower for bear traps) to qualify as a sweep.
• trap_score_risk: Minimum aggregated score required to flag a trap risk. (The code defines a trap_score_confirm input, but confirmation is actually based on price reversal rather than a separate score threshold.)
• trap_confirm_bars: Maximum number of bars allowed for price to reverse and confirm the trap. If price does not reverse in this window, the risk label will expire or remain unconfirmed.
• Label settings: ATR length and multiplier for offsetting, size, colours for risk and confirmed labels, and connector style and width. Separate settings exist for bull and bear traps.
• Toggle inputs: show_trap_module and show_trap_labels enable the module and control whether labels are drawn on the chart.
6.3 Scoring logic
The module assigns points to several conditions and sums them to determine whether a trap risk is present. For bull traps, the score is built from the following (bear traps mirror the logic with highs and lows swapped):
1. Sweep (2 points): Price trades above the high pivot (HH1) but fails to close above it and leaves a long upper wick at least trap_wick_threshold × range. For bear traps, price dips below the low pivot (LL1), fails to close below and leaves a long lower wick.
2. Close break (1 point): Price closes beyond HH1 or LL1 without leaving a long wick.
3. Candle/delta mismatch (2 points): The candle closes bullish yet the order flow delta is negative or the seller ratio exceeds 50%, indicating hidden supply. Conversely, a bearish close with positive delta or buyer dominance suggests hidden demand.
4. Dominance inversion (2 points): The current bar’s buyer volume has the highest rank in the lookback window while cumulative sums favor sellers, or vice versa.
5. Low‑volume break (1 point): Price crosses the pivot but total volume is below its moving average.
The total score for each side is compared to trap_score_risk. If the score is high enough, a “Bull Trap Risk” or “Bear Trap Risk” label is drawn, offset from the candle by half of an ATR‑scaled distance using a dashed outline. If, within trap_confirm_bars, price reverses beyond the opposite level—drops back below the high pivot for bull traps or rises above the low pivot for bear traps—the label is upgraded to a solid “Bull Trap” or “Bear Trap” . In this version of the code, there is no separate score threshold for confirmation: the variable trap_score_confirm is unused; confirmation depends solely on a successful price reversal within the specified number of bars.
Figure caption, In this example the trap module has flagged a Bear Trap Risk. Price initially breaks below the most recent low pivot (LL1), but the bar closes back above that level and leaves a long lower wick, suggesting a failed push lower. Combined with a mismatch between the candle direction and the order flow (buyers regain control) and a reversal in volume dominance, the aggregate score exceeds the risk threshold, so a dashed “Bear Trap Risk” label prints beneath the bar. The green and red trend lines mark the current low and high pivot trajectories, while the horizontal dashed lines show the highest and lowest values in the lookback window. If, within the next few bars, price closes decisively above the support, the risk label would upgrade to a solid “Bear Trap” label.
Figure caption, In this example the trap module has identified both ends of a price range. Near the highs, price briefly pushes above the descending red trendline and the recent pivot high, but fails to close there and leaves a noticeable upper wick. That combination of a sweep above resistance and order‑flow mismatch generates a Bull Trap Risk label with a dashed outline, warning that the upside break may not hold. At the opposite extreme, price later dips below the green trendline and the labelled low pivot, then quickly snaps back and closes higher. The long lower wick and subsequent price reversal upgrade the previous bear‑trap risk into a confirmed Bear Trap (solid label), indicating that sellers were caught on a false breakdown. Horizontal dashed lines mark the highest high and lowest low of the lookback window, while the red and green diagonals connect the earliest and latest pivot highs and lows to visualize the range.
7. Sharp Move Module
7.1 Concept
Markets sometimes display absorption or climax behavior—periods when one side steadily gains the upper hand before price breaks out with a sharp move. This module evaluates several order‑flow and volume conditions to anticipate such moves. Users can choose how many conditions must be met to flag a risk and how many (plus a price break) are required for confirmation.
7.2 Inputs
• sharp Lookback: Number of bars in the window used to compute moving averages, sums, percentile ranks and reference levels.
• sharpPercentile: Minimum percentile rank for the current side’s volume; the current buy (or sell) volume must be greater than or equal to this percentile of historical volumes over the lookback window.
• sharpVolMult: Multiplier used in the volume climax check. The current side’s volume must exceed this multiple of its average to count as a climax.
• sharpRatioThr: Minimum dominance ratio (current side’s volume relative to the opposite side) used in both the instant and cumulative dominance checks.
• sharpChurnThr: Maximum ratio of a bar’s range to its ATR for absorption/churn detection; lower values indicate more absorption (large volume in a small range).
• sharpScoreRisk: Minimum number of conditions that must be true to print a risk label.
• sharpScoreConfirm: Minimum number of conditions plus a price break required for confirmation.
• sharpCvdThr: Threshold for cumulative delta divergence versus price change (positive for bullish accumulation, negative for bearish distribution).
• Label settings: ATR length (sharpATRlen) and multiplier (sharpLabelMult) for positioning labels, label size, colors and connector styles for bullish and bearish sharp moves.
• Toggles: enableSharp activates the module; show_sharp_labels controls whether labels are drawn.
7.3 Conditions (six per side)
For each side, the indicator computes six boolean conditions and sums them to form a score:
1. Dominance (instant and cumulative):
– Instant dominance: current buy volume ≥ sharpRatioThr × current sell volume.
– Cumulative dominance: sum of buy volumes over the window ≥ sharpRatioThr × sum of sell volumes (and vice versa for bearish checks).
2. Accumulation/Distribution divergence: Over the lookback window, cumulative delta rises by at least sharpCvdThr while price fails to rise (bullish), or cumulative delta falls by at least sharpCvdThr while price fails to fall (bearish).
3. Volume climax: The current side’s volume is ≥ sharpVolMult × its average and the product of volume and bar range is the highest in the lookback window.
4. Absorption/Churn: The current side’s volume divided by the bar’s range equals the highest value in the window and the bar’s range divided by ATR ≤ sharpChurnThr (indicating large volume within a small range).
5. Percentile rank: The current side’s volume percentile rank is ≥ sharp Percentile.
6. Mirror logic for sellers: The above checks are repeated with buyer and seller roles swapped and the price break levels reversed.
Each condition that passes contributes one point to the corresponding side’s score (0 or 1). Risk and confirmation thresholds are then applied to these scores.
7.4 Scoring and labels
• Risk: If scoreBull ≥ sharpScoreRisk, a “Sharp ↑ Risk” label is drawn above the bar. If scoreBear ≥ sharpScoreRisk, a “Sharp ↓ Risk” label is drawn below the bar.
• Confirmation: A risk label is upgraded to “Sharp ↑” when scoreBull ≥ sharpScoreConfirm and the bar closes above the highest recent pivot (HH1); for bearish cases, confirmation requires scoreBear ≥ sharpScoreConfirm and a close below the lowest pivot (LL1).
• Label positioning: Labels are offset from the candle by ATR × sharpLabelMult (full ATR times multiplier), not half, and may include a dashed or dotted connector line if enabled.
Figure caption, In this chart both bullish and bearish sharp‑move setups have been flagged. Earlier in the range, a “Sharp ↓ Risk” label appears beneath a candle: the sell‑side score met the risk threshold, signaling that the combination of strong sell volume, dominance and absorption within a narrow range suggested a potential sharp decline. The price did not close below the lower pivot, so this label remains a “risk” and no confirmation occurred. Later, as the market recovered and volume shifted back to the buy side, a “Sharp ↑ Risk” label prints above a candle near the top of the channel. Here, buy‑side dominance, cumulative delta divergence and a volume climax aligned, but price has not yet closed above the upper pivot (HH1), so the alert is still a risk rather than a confirmed sharp‑up move.
Figure caption, In this chart a Sharp ↑ label is displayed above a candle, indicating that the sharp move module has confirmed a bullish breakout. Prior bars satisfied the risk threshold — showing buy‑side dominance, positive cumulative delta divergence, a volume climax and strong absorption in a narrow range — and this candle closes above the highest recent pivot, upgrading the earlier “Sharp ↑ Risk” alert to a full Sharp ↑ signal. The green label is offset from the candle with a dashed connector, while the red and green trend lines trace the high and low pivot trajectories and the dashed horizontals mark the highest and lowest values of the lookback window.
8. Market‑Maker / Spread‑Capture Module
8.1 Concept
Liquidity providers often “capture the spread” by buying and selling in almost equal amounts within a very narrow price range. These bars can signal temporary congestion before a move or reflect algorithmic activity. This module flags bars where both buyer and seller volumes are high, the price range is only a few ticks and the buy/sell split remains close to 50%. It helps traders spot potential liquidity pockets.
8.2 Inputs
• scalpLookback: Window length used to compute volume averages.
• scalpVolMult: Multiplier applied to each side’s average volume; both buy and sell volumes must exceed this multiple.
• scalpTickCount: Maximum allowed number of ticks in a bar’s range (calculated as (high − low) / minTick). A value of 1 or 2 captures ultra‑small bars; increasing it relaxes the range requirement.
• scalpDeltaRatio: Maximum deviation from a perfect 50/50 split. For example, 0.05 means the buyer share must be between 45% and 55%.
• Label settings: ATR length, multiplier, size, colors, connector style and width.
• Toggles : show_scalp_module and show_scalp_labels to enable the module and its labels.
8.3 Signal
When, on the current bar, both TF_buy_breakout and TF_sell_breakout exceed scalpVolMult times their respective averages and (high − low)/minTick ≤ scalpTickCount and the buyer share is within scalpDeltaRatio of 50%, the module prints a “Spread ↔” label above the bar. The label uses the same ATR offset logic as other modules and draws a connector if enabled.
Figure caption, In this chart the spread‑capture module has identified a potential liquidity pocket. Buyer and seller volumes both spiked above their recent averages, yet the candle’s range measured only a couple of ticks and the buy/sell split stayed close to 50 %. This combination met the module’s criteria, so it printed a grey “Spread ↔” label above the bar. The red and green trend lines link the earliest and latest high and low pivots, and the dashed horizontals mark the highest high and lowest low within the current lookback window.
9. Money Flow Module
9.1 Concept
To translate volume into a monetary measure, this module multiplies each side’s volume by the closing price. It tracks buying and selling system money default currency on a per-bar basis and sums them over a chosen period. The difference between buy and sell currencies (Δ$) shows net inflow or outflow.
9.2 Inputs
• mf_period_len_mf: Number of bars used for summing buy and sell dollars.
• Label appearance settings: ATR length, multiplier, size, colors for up/down labels, and connector style and width.
• Toggles: Use enableMoneyFlowLabel_mf and showMFLabels to control whether the module and its labels are displayed.
9.3 Calculations
• Per-bar money: Buy $ = TF_buy_breakout × close; Sell $ = TF_sell_breakout × close. Their difference is Δ$ = Buy $ − Sell $.
• Summations: Over mf_period_len_mf bars, compute Σ Buy $, Σ Sell $ and ΣΔ$ using math.sum().
• Info table entries: Rows 9–13 display these values as texts like “↑ USD 1234 (1M)” or “ΣΔ USD −5678 (14)”, with colors reflecting whether buyers or sellers dominate.
• Money flow status: If Δ$ is positive the bar is marked “Money flow in” ; if negative, “Money flow out” ; if zero, “Neutral”. The cumulative status is similarly derived from ΣΔ.Labels print at the bar that changes the sign of ΣΔ, offset using ATR × label multiplier and styled per user preferences.
Figure caption, The chart illustrates a steady rise toward the highest recent pivot (HH1) with price riding between a rising green trend‑line and a red trend‑line drawn through earlier pivot highs. A green Money flow in label appears above the bar near the top of the channel, signaling that net dollar flow turned positive on this bar: buy‑side dollar volume exceeded sell‑side dollar volume, pushing the cumulative sum ΣΔ$ above zero. In the info table, the “Money flow (bar)” and “Money flow Σ” rows both read In, confirming that the indicator’s money‑flow module has detected an inflow at both bar and aggregate levels, while other modules (pivots, trend lines and support/resistance) remain active to provide structural context.
In this example the Money Flow module signals a net outflow. Price has been trending downward: successive high pivots form a falling red trend‑line and the low pivots form a descending green support line. When the latest bar broke below the previous low pivot (LL1), both the bar‑level and cumulative net dollar flow turned negative—selling volume at the close exceeded buying volume and pushed the cumulative Δ$ below zero. The module reacts by printing a red “Money flow out” label beneath the candle; the info table confirms that the “Money flow (bar)” and “Money flow Σ” rows both show Out, indicating sustained dominance of sellers in this period.
10. Info Table
10.1 Purpose
When enabled, the Info Table appears in the lower right of your chart. It summarises key values computed by the indicator—such as buy and sell volume, delta, total volume, breakout status, market phase, and money flow—so you can see at a glance which side is dominant and which signals are active.
10.2 Symbols
• ↑ / ↓ — Up (↑) denotes buy volume or money; down (↓) denotes sell volume or money.
• MA — Moving average. In the table it shows the average value of a series over the lookback period.
• Σ (Sigma) — Cumulative sum over the chosen lookback period.
• Δ (Delta) — Difference between buy and sell values.
• B / S — Buyer and seller share of total volume, expressed as percentages.
• Ref. Price — Reference price for breakout calculations, based on the latest pivot.
• Status — Indicates whether a breakout condition is currently active (True) or has failed.
10.3 Row definitions
1. Up volume / MA up volume – Displays current buy volume on the lower timeframe and its moving average over the lookback period.
2. Down volume / MA down volume – Shows current sell volume and its moving average; sell values are formatted in red for clarity.
3. Δ / ΣΔ – Lists the difference between buy and sell volume for the current bar and the cumulative delta volume over the lookback period.
4. Σ / MA Σ (Vol/MA) – Total volume (buy + sell) for the bar, with the ratio of this volume to its moving average; the right cell shows the average total volume.
5. B/S ratio – Buy and sell share of the total volume: current bar percentages and the average percentages across the lookback period.
6. Buyer Rank / Seller Rank – Ranks the bar’s buy and sell volumes among the last (n) bars; lower rank numbers indicate higher relative volume.
7. Σ Buy / Σ Sell – Sum of buy and sell volumes over the lookback window, indicating which side has traded more.
8. Breakout UP / DOWN – Shows the breakout thresholds (Ref. Price) and whether the breakout condition is active (True) or has failed.
9. Market Phase (Vol) – Reports the current volume‑only phase: Accumulation, Distribution or Neutral.
10. Money Flow – The final rows display dollar amounts and status:
– ↑ USD / Σ↑ USD – Buy dollars for the current bar and the cumulative sum over the money‑flow period.
– ↓ USD / Σ↓ USD – Sell dollars and their cumulative sum.
– Δ USD / ΣΔ USD – Net dollar difference (buy minus sell) for the bar and cumulatively.
– Money flow (bar) – Indicates whether the bar’s net dollar flow is positive (In), negative (Out) or neutral.
– Money flow Σ – Shows whether the cumulative net dollar flow across the chosen period is positive, negative or neutral.
The chart above shows a sequence of different signals from the indicator. A Bull Trap Risk appears after price briefly pushes above resistance but fails to hold, then a green Accum label identifies an accumulation phase. An upward breakout follows, confirmed by a Money flow in print. Later, a Sharp ↓ Risk warns of a possible sharp downturn; after price dips below support but quickly recovers, a Bear Trap label marks a false breakdown. The highlighted info table in the center summarizes key metrics at that moment, including current and average buy/sell volumes, net delta, total volume versus its moving average, breakout status (up and down), market phase (volume), and bar‑level and cumulative money flow (In/Out).
11. Conclusion & Final Remarks
This indicator was developed as a holistic study of market structure and order flow. It brings together several well‑known concepts from technical analysis—breakouts, accumulation and distribution phases, overbought and oversold extremes, bull and bear traps, sharp directional moves, market‑maker spread bars and money flow—into a single Pine Script tool. Each module is based on widely recognized trading ideas and was implemented after consulting reference materials and example strategies, so you can see in real time how these concepts interact on your chart.
A distinctive feature of this indicator is its reliance on per‑side volume: instead of tallying only total volume, it separately measures buy and sell transactions on a lower time frame. This approach gives a clearer view of who is in control—buyers or sellers—and helps filter breakouts, detect phases of accumulation or distribution, recognize potential traps, anticipate sharp moves and gauge whether liquidity providers are active. The money‑flow module extends this analysis by converting volume into currency values and tracking net inflow or outflow across a chosen window.
Although comprehensive, this indicator is intended solely as a guide. It highlights conditions and statistics that many traders find useful, but it does not generate trading signals or guarantee results. Ultimately, you remain responsible for your positions. Use the information presented here to inform your analysis, combine it with other tools and risk‑management techniques, and always make your own decisions when trading.

VP + Game Theory Integrated Strategy9s için DüşünceVP + Game Theory Integrated Strategy Indicator: Explanation and Working Logic
Hello! You can upload the provided Pine Script code to TradingView. This is compatible with Pine Script Editor (v6 version) – simply copy-paste it directly. The indicator's name is "VP + Game Theory Integrated Strategy," and since overlay=true, it will display on top of the price chart (over the candlesticks). Maximum boxes, lines, and labels are set to 500, so it handles dense charts without performance issues.
Below, I'll provide a detailed explanation of the indicator, its working logic, main components, and usage tips step by step. This indicator integrates Volume Profile (VP), Game Theory, and Wick (Candle Wick) Patterns to generate buy/sell signals. It aims to detect high-probability reversal points by analyzing market liquidity, herd behavior, and institutional movements. It's suitable for crypto, forex, or stock markets, but always backtest before using in live trading.
1. General Description
Purpose: This indicator combines volume-based analysis (Volume Profile), game theory elements (herd behavior, Nash equilibrium, contrarian strategies), and candle wick patterns. It identifies strong resistance/support levels (POC, VAH/VAL, liquidity zones) and generates "Power" signals based on them. Signals are shown with labels, lines, and alerts for buy (green) or sell (red).
Key Features:
Volume Profile (VP): Calculates high-volume areas (POC: Point of Control, the highest volume level; VAH/VAL: Value Area High/Low) and displays them on the chart.
Game Theory (GT): Models the market as "players" (retail herd, institutions). Detects herd buying/selling panics and generates contrarian signals.
Wick-Based Signals: Captures reversals with large wicks. Applies strict criteria for "Power" and "Ultra Power" levels.
Market Maker (MM) Elements: Monitors liquidity traps and institutional volume spikes.
Visualization: Nash bands, liquidity boxes, info table (top-right), background colors, and alerts.
Signal Types: Normal, Power, Ultra Power, GT-confirmed. Signals are limited (max 1-5 per zone) with a minimum wait time (40 bars).
Input Parameters: Grouped into 3 sections (GT, Wick, VP, MM). Default values are balanced, but customizable (e.g., strictMode=true makes it more selective).
Warning: This is an indicator, not a full strategy. It includes alerts, but add stop-loss/take-profit for risk management. Use TradingView's Strategy Tester for backtesting.
2. Working Logic (Step by Step)
The indicator processes each bar (candle) as follows:
a. Basic Calculations
ATR (Average True Range): Measures volatility (20 periods). Candle size (high-low) must be at least ATR x 2.5 for signals to be valid.
Candle Components: Calculates candle body (close-open), upper/lower wick.
Volume Analysis: Average volume (SMA 20), detects spikes (based on threshold).
Trend Filter: EMAs (20/50/200) determine up/downtrend. In strict mode, it's stricter (strong uptrend: EMA20 > EMA50 > EMA200 and close > EMA20).
b. Game Theory (GT) Component
Herd Behavior: RSI (14) overbought/oversold (70/30) + volume spike + momentum detects it. Herd buying: Overbuying frenzy (red background). Herd selling: Selling panic (green background).
Institutional Flow: Volume > average x 2.5 + Accumulation/Distribution (AD) indicator. Accumulation: Institutions buying (strengthens buy signals). Distribution: Selling (strengthens sell).
Liquidity Traps: In the last 50 bars, if a new high/low is broken but close pulls back + volume spike = Trap (up/down).
Smart Money: Intra-candle movement (close-open)/(high-low) x volume. Positive = Smart money inflow.
Nash Equilibrium: Price mean (SMA 100) ± deviation (stdev x 0.02). In equilibrium: Normal. Above: Sell potential. Below: Buy. Bands are optionally shown.
GT Signals:
Contrarian: Herd selling + accumulation = Buy.
Momentum: Below Nash + positive smart money = Buy (opposite for sell).
Nash Reversion: Below Nash + rising close + volume = Buy.
Power Signal: At least 3 GT signals (min_signals_for_power=3) + volume confirmation = Power GT buy/sell. Can show only GT-confirmed signals (show_gt_only_signals=true).
c. Volume Profile (VP) Component
Calculation: For the last 100 bars (vpPeriod), divides the price range (high-low) into vpRows (24) rows. Distributes volume across rows.
POC (Point of Control): Highest volume level (orange line). Threshold 80% (pocThreshold).
Value Area (VA): 70% of total volume (valueAreaPercent). VAH (upper bound, blue dotted), VAL (lower bound).
High-Volume Area: Price near POC or volume > POC x 80% = Strong zone.
Visualization: Histogram boxes on the right (blue/orange). POC/VAH/VAL lines and labels.
d. Wick (Candle Wick) and Power Signals
Main Wick Criteria: Large candle (ATR x 2.5), small body (<8%), wick 8x body length (anaFitilCarpan) and 80% of candle (anaFitilYuzde). High volume + trend filter (downtrend for upper wick).
Signal Wick: More flexible for triggers (5x length, 70%).
Power/Ultra Power:
Power Sell: Main upper wick + near POC/VAH + MM volume (2.5x) + GT contrarian/momentum.
Power Buy: Similar for lower wick.
Super Wick: Power + institutional volume + strong momentum.
Ultra Power: Super + GT power (3/3) + distribution/accumulation + Nash deviation + liquidity trap. Rarest and strongest (fuchsia/lime color).
Signal Management: Detected wick level (high/low) is saved. Wait min 40 bars, max 1-5 signals per zone. When trigger candle arrives (price reaches level + long wick + close in opposite direction) = BUY/SELL plotshape.
e. Market Maker (MM) and Liquidity
MM Volume: Average x 2.5 + wick bonus (1.3x).
Liquidity Zones: Saves last 20 high-volume highs/lows. Shown as boxes on chart (red/green, lasting 200 bars).
Traps: Integrated with GT, strengthens power signals.
f. Visualization and Alerts
Background: Ultra Power (fuchsia/lime), Power GT (red/green), Herd (red/green).
Lines: Active resistance/support (dashed, colored).
Table (Top-Right): Resistance/support levels, remaining signals, POC/VAH/VAL, GT status (herd, institutional, Nash, signal strength), volume/liquidity.
Alerts: For Ultra Power, GT Power, Super Wick, normal signals. Messages include level/price.
g. Filters and Options
Strict Mode: Stricter (higher volume 1.5x, strong trend, RSI filter).
Require Volume Confirmation: Mandatory volume check.
Only Show Power Signals: Display only power/ultra.
Require Ultra Power: Strictest, only ultra.
3. Usage Tips
Chart Timeframe: H1-D1 for medium-long term. Shorter frames (M1-M5) may produce too many signals.
Settings:
StrictMode=true: Fewer but higher-quality signals.
Use_game_theory=false: Use only VP + Wicks.
ShowVP=false: Hide histogram to reduce clutter.
Strategy Integration: Filter BUY/SELL with EMAs. Stop-loss: ATR x 1-2, Take-profit: POC/VAH levels.
Backtesting: Convert to strategy in TradingView (use alertconditions). Test on historical data.
Risk: Designed for market manipulation (MM traps), but no indicator is 100% accurate. Apply capital management.
Troubleshooting: If errors (e.g., vpInitialized=false), increase period or refresh chart.
This indicator is complex but powerful – blending VP for volume zones with GT for psychology. If you have questions or need setting changes, let me know!

Price Action Smart Money Concepts [BigBeluga]THE SMART MONEY CONCEPTS Toolkit
The Smart Money Concepts [ BigBeluga ] is a comprehensive toolkit built around the principles of "smart money" behavior, which refers to the actions and strategies of institutional investors.
The Smart Money Concepts Toolkit brings together a suite of advanced indicators that are all interconnected and built around a unified concept: understanding and trading like institutional investors, or "smart money." These indicators are not just randomly chosen tools; they are features of a single overarching framework, which is why having them all in one place creates such a powerful system.
This all-in-one toolkit provides the user with a unique experience by automating most of the basic and advanced concepts on the chart, saving them time and improving their trading ideas.
Real-time market structure analysis simplifies complex trends by pinpointing key support, resistance, and breakout levels.
Advanced order block analysis leverages detailed volume data to pinpoint high-demand zones, revealing internal market sentiment and predicting potential reversals. This analysis utilizes bid/ask zones to provide supply/demand insights, empowering informed trading decisions.
Imbalance Concepts (FVG and Breakers) allows traders to identify potential market weaknesses and areas where price might be attracted to fill the gap, creating opportunities for entry and exit.
Swing failure patterns help traders identify potential entry points and rejection zones based on price swings.
Liquidity Concepts, our advanced liquidity algorithm, pinpoints high-impact events, allowing you to predict market shifts, strong price reactions, and potential stop-loss hunting zones. This gives traders an edge to make informed trading decisions based on liquidity dynamics.
🔵 FEATURES
The indicator has quite a lot of features that are provided below:
Swing market structure
Internal market structure
Mapping structure
Adjustable market structure
Strong/Weak H&L
Sweep
Volumetric Order block / Breakers
Fair Value Gaps / Breakers (multi-timeframe)
Swing Failure Patterns (multi-timeframe)
Deviation area
Equal H&L
Liquidity Prints
Buyside & Sellside
Sweep Area
Highs and Lows (multi-timeframe)
🔵 BASIC DEMONSTRATION OF ALL FEATURES
1. MARKET STRUCTURE
The preceding image illustrates the market structure functionality within the Smart Money Concepts indicator.
➤ Solid lines: These represent the core indicator's internal structure, forming the foundation for most other components. They visually depict the overall market direction and identify major reversal points marked by significant price movements (denoted as 'x').
➤ Internal Structure: These represent an alternative internal structure with the potential to drive more rapid market shifts. This is particularly relevant when a significant gap exists in the established swing structure, specifically between the Break of Structure (BOS) and the most recent Change of High/Low (CHoCH). Identifying these formations can offer opportunities for quicker entries and potential short-term reversals.
➤ Sweeps (x): These signify potential turning points in the market where liquidity is removed from the structure. This suggests a possible trend reversal and presents crucial entry opportunities. Sweeps are identified within both swing and internal structures, providing valuable insights for informed trading decisions.
➤ Mapping structure: A tool that automatically identifies and connects significant price highs and lows, creating a zig-zag pattern. It visualizes market structure, highlights trends, support/resistance levels, and potential breakouts. Helps traders quickly grasp price action patterns and make informed decisions.
➤ Color-coded candles based on market structure: These colors visually represent the underlying market structure, making it easier for traders to quickly identify trends.
➤ Extreme H&L: It visualizes market structure with extreme high and lows, which gives perspective for macro Market Structure.
2. VOLUMETRIC ORDER BLOCKS
Order blocks are specific areas on a financial chart where significant buying or selling activity has occurred. These are not just simple zones; they contain valuable information about market dynamics. Within each of these order blocks, volume bars represent the actual buying and selling activity that took place. These volume bars offer deeper insights into the strength of the order block by showing how much buying or selling power is concentrated in that specific zone.
Additionally, these order blocks can be transformed into Breaker Blocks. When an order block fails—meaning the price breaks through this zone without reversing—it becomes a breaker block. Breaker blocks are particularly useful for trading breakouts, as they signal that the market has shifted beyond a previously established zone, offering opportunities for traders to enter in the direction of the breakout.
Here's a breakdown:
➤ Bear Order Blocks (Red): These are zones where a lot of selling happened. Traders see these areas as places where sellers were strong, pushing the price down. When the price returns to these zones, it might face resistance and drop again.
➤ Bull Order Blocks (Green): These are zones where a lot of buying happened. Traders see these areas as places where buyers were strong, pushing the price up. When the price returns to these zones, it might find support and rise again.
These Order Blocks help traders identify potential areas for entering or exiting trades based on past market activity. The volume bars inside blocks show the amount of trading activity that occurred in these blocks, giving an idea of the strength of buying or selling pressure.
➤ Breaker Block: When an order block fails, meaning the price breaks through this zone without reversing, it becomes a breaker block. This indicates a significant shift in market liquidity and structure.
➤ A bearish breaker block occurs after a bullish order block fails. This typically happens when there's an upward trend, and a certain level that was expected to support the market's rise instead gives way, leading to a sharp decline. This decline indicates that sellers have overcome the buyers, absorbing liquidity and shifting the sentiment from bullish to bearish.
Conversely, a bullish breaker block is formed from the failure of a bearish order block. In a downtrend, when a level that was expected to act as resistance is breached, and the price shoots up, it signifies that buyers have taken control, overpowering the sellers.
3. FAIR VALUE GAPS:
A fair value gap (FVG), also referred to as an imbalance, is an essential concept in Smart Money trading. It highlights the supply and demand dynamics. This gap arises when there's a notable difference between the volume of buy and sell orders. FVGs can be found across various asset classes, including forex, commodities, stocks, and cryptocurrencies.
FVGs in this toolkit have the ability to detect raids of FVG which helps to identify potential price reversals.
Mitigation option helps to change from what source FVGs will be identified: Close, Wicks or AVG.
4. SWING FAILURE PATTERN (SFP):
The Swing Failure Pattern is a liquidity engineering pattern, generally used to fill large orders. This means, the SFP generally occurs when larger players push the price into liquidity pockets with the sole objective of filling their own positions.
SFP is a technical analysis tool designed to identify potential market reversals. It works by detecting instances where the price briefly breaks a previous high or low but fails to maintain that breakout, quickly reversing direction.
How it works:
Pattern Detection: The indicator scans for price movements that breach recent highs or lows.
Reversal Confirmation: If the price quickly reverses after breaching these levels, it's identified as an SFP.
➤ SFP Display:
Bullish SFP: Marked with a green symbol when price drops below a recent low before reversing upwards.
Bearish SFP: Marked with a red symbol when price rises above a recent high before reversing downwards.
➤ Deviation Levels: After detecting an SFP, the indicator projects white lines showing potential price deviation:
For bullish SFPs, the deviation line appears above the current price.
For bearish SFPs, the deviation line appears below the current price.
These deviation levels can serve as a potential trading opportunity or areas where the reversal might lose momentum.
With Volume Threshold and Filtering of SFP traders can adjust their trading style:
Volume Threshold: This setting allows traders to filter SFPs based on the volume of the reversal candle. By setting a higher volume threshold, traders can focus on potentially more significant reversals that are backed by higher trading activity.
SFP Filtering: This feature enables traders to filter SFP detection. It includes parameters such as:
5. LIQUIDITY CONCEPTS:
➤ Equal Lows (EQL) and Equal Highs (EQH) are important concepts in liquidity-based trading.
EQL: A series of two or more swing lows that occur at approximately the same price level.
EQH: A series of two or more swing highs that occur at approximately the same price level.
EQLs and EQHs are seen as potential liquidity pools where a large number of stop loss orders or limit orders may be clustered. They can be used as potential reverse points for trades.
This multi-period feature allows traders to select less and more significant EQL and EQH:
➤ Liquidity wicks:
Liquidity wicks are a minor representation of a stop-loss hunt during the retracement of a pivot point:
➤ Buy and Sell side liquidity:
The buy side liquidity represents a concentration of potential buy orders below the current price level. When price moves into this area, it can lead to increased buying pressure due to the execution of these orders.
The sell side liquidity indicates a pool of potential sell orders below the current price level. Price movement into this area can result in increased selling pressure as these orders are executed.
➤ Sweep Liquidation Zones:
Sweep Liquidation Zones are crucial for understanding market structure and potential future price movements. They provide insights into areas where significant market participants have been forced out of their positions, potentially setting up new trading opportunities.
🔵 USAGE & EXAMPLES
The core principle behind the success of this toolkit lies in identifying "confluence." This refers to the convergence of multiple trading indicators all signaling the same information at a specific point or area. By seeking such alignment, traders can significantly enhance the likelihood of successful trades.
MS + OBs
The chart illustrates a highly bullish setup where the price is rejecting from a bullish order block (POC), while simultaneously forming a bullish Swing Failure Pattern (SFP). This occurs after an internal structure change, marked by a bullish Change of Character (CHoCH). The price broke through a bearish order block, transforming it into a breaker block, further confirming the bullish momentum.
The combination of these elements—bullish order blocks, SFP, and CHoCH—creates a powerful bullish signal, reinforcing the potential for upward movement in the market.
SFP + Bear OB
This chart above displays a bearish setup with a high probability of a price move lower. The price is currently rejecting from a bear order block, which represents a key resistance area where significant selling pressure has previously occurred. A Swing Failure Pattern (SFP) has also formed near this bear order block, indicating that the price briefly attempted to break above a recent high but failed to sustain that upward movement. This failure suggests that buyers are losing momentum, and the market could be preparing for a move to the downside.
Additionally, we can toggle on the Deviation Area in the SFP section to highlight potential levels where price deviation might occur. These deviation areas represent zones where the price is likely to react after the Swing Failure Pattern:
BUY – SELL sides + EQL
The chart showcases a bullish setup with a high probability of price breaking out of the current sell-side resistance level. The market structure indicates a formation of Equal Lows (EQL), which often suggests a build-up of liquidity that could drive the price higher.
The presence of strong buy-side pressure (69%), indicated by the green zone at the bottom, reinforces this bullish outlook. This area represents a key support zone where buyers are outpacing sellers, providing the foundation for a potential upward breakout.
EQL + Bull ChoCh
This chart illustrates a potential bullish setup, driven by the formation of Equal Lows (EQL) followed by a bullish Change of Character (CHoCH). The presence of Equal Lows often signals a liquidity build-up, which can lead to a reversal when combined with additional bullish signals.
Liquidity grab + Bull ChoCh + FVGs
This chart demonstrates a strong bullish scenario, where several important market dynamics are at play. The price begins its upward momentum from Liquidity grab following a bullish Change of Character (CHoCH), signaling the transition from a bearish phase to a bullish one.
As the price progresses, it performs liquidity grabs, which serve to gather the necessary fuel for further movement. These liquidity grabs often occur before significant price surges, as large market participants exploit these areas to accumulate positions before pushing the price higher.
The chart also highlights a market imbalance area, showing strong momentum as the price moves swiftly through this zone.
In this examples, we see how the combination of multiple “smart money” tools helps identify a potential trade opportunities. This is just one of the many scenarios that traders can spot using this toolkit. Other combinations—such as order blocks, liquidity grabs, fair value gaps, and Swing Failure Patterns (SFPs)—can also be layered on top of these concepts to further refine your trading strategy.
🔵 SETTINGS
Window: limit calculation period
Swing: limit drawing function
Mapping structure: show structural points
Algorithmic Logic: (Extreme-Adjusted) Use max high/low or pivot point calculation
Algorithmic loopback: pivot point look back
Show Last: Amount of Order block to display
Hide Overlap: hide overlapping order blocks
Construction: Size of the order blocks
Fair value gaps: Choose between normal FVG or Breaker FVG
Mitigation: (close - wick - avg) point to mitigate the order block/imbalance
SFP lookback: find a higher / lower point to improve accuracy
Threshold: remove less relevant SFP
Equal H&L: (short-mid-long term) display longer term
Liquidity Prints: Shows wicks of candles where liquidity was grabbed
Sweep Area: Identify Sweep Liquidation areas
By combining these indicators in one toolkit, traders are equipped with a comprehensive suite of tools that address every angle of the Smart Money Concept. Instead of relying on disparate tools spread across various platforms, having them integrated into a single, cohesive system allows traders to easily see confluence and make more informed trading decisions.

Nexural OrderFlow MatrixNexural OrderFlow Matrix
### Professional Order Flow Analysis for Index Futures on TradingView
**Specifically Engineered for:** ES, NQ, YM, RTY, and other high-liquidity index futures
---
## Before You Read Any Further
I need to be upfront with you about something important.
**True order flow analysis—the kind used by institutional traders and prop firms—is not possible on TradingView.**
When professionals talk about order flow, they're referring to the raw tape: every single trade, the exact price, the exact size, and whether it was a buyer lifting the offer or a seller hitting the bid. That level of data simply doesn't exist in TradingView's infrastructure.
So why did I build this indicator? Because TradingView *does* provide meaningful volume delta data through their official functions, and when presented correctly, it can still give you a genuine edge in understanding buying and selling pressure—especially on **index futures** where liquidity is deep and the uptick/downtick methodology works best.
This indicator was specifically engineered with index futures traders in mind. The data sources, the color thresholds, the activity calculations—all of it is optimized for the characteristics of ES, NQ, YM, and RTY. It can work on other instruments, but index futures are where it shines.
I'm not here to oversell you. I'm here to give you the best tool possible within the platform's limitations—and to be completely transparent about what those limitations are.
---
## What This Indicator Actually Does
Nexural OrderFlow Matrix uses TradingView's most advanced volume analysis functions under the hood:
- `ta.requestUpAndDownVolume()` — Samples lower timeframe data to estimate volume on upticks vs downticks
- `ta.requestVolumeDelta()` — TradingView's official cumulative volume delta calculation
The indicator presents this data in two ways:
**1. The Matrix Table**
A heatmap grid aligned beneath each candle showing:
- **Volume** — Total bar volume with yellow/gold intensity gradient
- **Bar VWAP** — Volume-weighted average price within the bar
- **Delta** — Net difference between buying and selling volume
- **Delta %** — Delta as a percentage of total volume (the most important metric)
- **Bar Δ CVD** — How much cumulative volume delta changed this bar
- **Buy Volume** — Estimated volume on upticks
- **Sell Volume** — Estimated volume on downticks
**2. The Imbalance Bars**
A visual stacked bar chart showing the proportional split between buyers and sellers. Green on top represents buying volume, red on bottom represents selling volume. The split is proportional—so a 70/30 bar instantly shows you the imbalance without reading numbers.
**3. The Nexural Flow Meter**
A real-time panel showing:
- Current bias (BUYERS/SELLERS/NEUTRAL)
- Intensity classification (EXTREME/STRONG/MODERATE/WEAK)
- Imbalance ratio (e.g., "BUY 2.3:1")
- Live delta, volume, and VWAP readings
---
## The Color System
I spent considerable time on this because it matters.
Most indicators treat all bars equally. That's noise. In reality, a bar with 8% delta imbalance tells you almost nothing, while a bar with 65% imbalance is screaming information at you.
**The Activity Threshold System:**
- Bars below your threshold (default 25% delta) fade to muted gray tones
- As imbalance increases, colors transition from gray → muted color → vibrant color
- High-activity bars pop with bright greens and reds
- Low-activity bars fade into the background where they belong
**Volume uses a separate yellow/gold gradient:**
- Low volume: Faint, dark yellow-brown
- High volume: Rich, vibrant amber/gold
- This lets you instantly spot volume spikes without reading numbers
The result: your eye is naturally drawn to the bars that matter.
---
## Honest Accuracy Assessment
Based on extensive comparison testing against TradingView's own Volume Footprint and CVD indicators, this indicator achieves approximately **85-90% correlation** with official TradingView tools.
Let me put that in perspective:
| Platform | Data Source | Typical Accuracy |
|----------|-------------|------------------|
| Sierra Chart (Denali feed) | Actual bid/ask tape | 99%+ |
| Bookmap | Actual bid/ask tape | 99%+ |
| NinjaTrader + Kinetick | Tick-level data | 95-99% |
| Jigsaw Daytradr | Reconstructed tape | 95-99% |
| **TradingView (this indicator)** | **Aggregated LTF sampling** | **85-90%** |
| Generic volume indicators | Basic volume only | 50-60% |
We're at the ceiling of what TradingView can provide. The dual data source approach, official library functions, and lower timeframe sampling squeeze out every drop of accuracy the platform allows.
But if you're a dedicated tape reader who needs to see every lot hitting the book, this isn't the tool for that. No TradingView indicator is. That's not a criticism—it's just the reality of the platform's architecture.
---
## Where This Indicator Works Best
### Primary Use Case: Index Futures
This indicator was built specifically for index futures traders. These instruments have the characteristics that make order flow analysis most reliable:
**The Big Four:**
| Symbol | Name | Why It Works |
|--------|------|--------------|
| **ES** | E-mini S&P 500 | Deepest liquidity in the world, tight spreads, clean delta readings |
| **NQ** | E-mini NASDAQ-100 | Massive volume, excellent uptick/downtick correlation |
| **YM** | E-mini Dow | Strong institutional participation, reliable volume data |
| **RTY** | E-mini Russell 2000 | Good liquidity, solid delta accuracy |
Index futures are ideal because:
- **Deep liquidity** — Thousands of contracts per minute means meaningful sample sizes
- **Tight spreads** — Usually 1 tick, so bid/ask attribution is more accurate
- **Continuous trading** — No gaps during RTH, consistent data flow
- **Institutional participation** — Real order flow, not retail noise
- **Official CME volume** — Accurate, exchange-reported data
If you're trading ES, NQ, YM, or RTY on TradingView, this indicator will give you the most accurate order flow approximation the platform can provide.
---
### Secondary Use Cases
**Other Liquid Futures:**
- CL, GC, SI (commodities) — Work well but slightly less optimized
- 6E, 6B, 6J (currency futures) — Decent accuracy with good liquidity
**Large-Cap Stocks & ETFs:**
- SPY, QQQ, IWM
- AAPL, MSFT, NVDA, TSLA, AMD
- Any stock trading millions of shares daily
**Crypto (with caveats):**
- BTC, ETH on major exchanges
- Works best during active hours
- Quality varies by exchange data feed
**Best Timeframes:**
- 1-minute to 15-minute for active intraday trading
- The indicator automatically selects appropriate lower timeframe sampling
- Can work on higher timeframes but edge diminishes
---
## Where This Indicator Struggles
I could hide this section and let you figure it out the hard way. I'd rather just tell you.
**Low-Volume Stocks:**
If a stock trades 50,000 shares a day, the delta readings will be noisy and inconsistent. The uptick/downtick estimation needs sufficient trade activity to be meaningful.
**Wide-Spread Instruments:**
When spreads are 10+ cents wide, a trade at the ask doesn't necessarily indicate aggressive buying. The bid/ask classification becomes less reliable.
**Forex:**
TradingView shows broker-specific volume for forex, not actual market volume. Readings will vary wildly depending on your data provider. Use with extreme caution, or not at all.
**Pre-Market & After-Hours:**
Liquidity thins dramatically. Estimations become less reliable. I'd trust regular session data far more.
**Daily/Weekly/Monthly Charts:**
The aggregation becomes so smoothed that the edge largely disappears. This is designed for intraday analysis.
---
## How to Actually Use This
### Focus on Delta %, Not Raw Delta
Raw delta is influenced by overall volume. A 500-lot delta sounds significant until you realize the bar traded 50,000 lots—that's just 1% imbalance, which is noise.
Delta % normalizes this. Look for readings above ±30% to identify meaningful pressure. Above ±50% is strong. Above ±70% is extreme.
### Let the Colors Guide You
If a bar is gray, the market isn't showing its hand. Don't overanalyze it. When you see bright green or red cells, that's when something is happening.
### Confirm With Price Action
Order flow data is context, not a signal generator. A strong bullish delta at a key support level means something different than the same reading in the middle of nowhere.
Use this alongside your existing analysis—levels, structure, momentum—not as a replacement.
### Watch for Divergences
Price making new highs while delta turns negative? That's absorption—sellers stepping in but price hasn't reacted yet.
Price dropping but delta stays positive? Buyers are defending.
These divergences often precede reversals. They're where order flow analysis provides genuine edge.
### Adjust the Activity Threshold
The default is 25%. For volatile instruments like NQ futures, you might lower it to 20%. For calmer instruments, raise it to 30-35%. The goal is filtering noise while keeping meaningful signals visible.
---
## Understanding the Metrics
| Metric | What It Tells You |
|--------|-------------------|
| **Volume** | Total contracts/shares traded |
| **Delta** | Net buying minus selling volume |
| **Delta %** | How imbalanced the bar is (key metric) |
| **Bar Δ CVD** | Cumulative delta change for this bar |
| **Imbalance Ratio** | Buy:Sell ratio (e.g., 2.1:1 or 1:1.8) |
| **Bar VWAP** | Where most volume transacted within the bar |
| Delta % Range | Interpretation |
|---------------|----------------|
| 0-15% | Neutral, no clear pressure |
| 15-30% | Weak directional bias |
| 30-50% | Moderate pressure |
| 50-70% | Strong imbalance |
| 70%+ | Extreme one-sided flow |
| Color | Meaning |
|-------|---------|
| Gray | Low activity, likely noise |
| Muted Green | Mild buying pressure |
| Bright Green | Strong buying pressure |
| Muted Red | Mild selling pressure |
| Bright Red | Strong selling pressure |
| Yellow/Gold | Volume intensity (separate scale) |
---
## Settings Breakdown
**Display Settings:**
- *Show Matrix Table* — Toggle the data heatmap on/off
- *Show Imbalance Bars* — Toggle the stacked visual bars on/off
- *Row Height* — Adjust the matrix row sizing
- *Activity Threshold* — Delta % below which bars fade to gray
**Imbalance Bars:**
- *Bar Height* — Vertical size of the stacked bars
- *Show Volume Labels* — Display buy/sell volume numbers
- *Show Percentage* — Display buy/sell percentages
**Timeframe Mode:**
- *Auto* — Sensible defaults based on your chart timeframe
- *Aggressive* — Samples from lowest possible timeframe (more granular)
- *Conservative* — Samples from slightly higher timeframe (smoother)
- *Custom* — You choose the exact lower timeframe
**CVD Reset:**
- *Daily* — Standard for intraday trading
- *Weekly/Monthly* — Useful for swing analysis
- *None* — Running cumulative total
---
## A Note on Expectations
I built this to be the best possible order flow tool within TradingView's constraints. It uses every optimization available, presents data in a clean and functional way, and doesn't pretend to be something it's not.
But I want to be clear: if order flow is central to your strategy and you're making decisions based on tape reading, you should seriously consider platforms designed for that purpose. Sierra Chart, Bookmap, Jigsaw—these tools show you the actual order book and time & sales. The difference is substantial.
Think of Nexural OrderFlow Matrix as a bridge. It gives TradingView users access to order flow concepts with reasonable accuracy. For many traders, especially those combining multiple analysis methods, that's enough. For dedicated tape readers, it's a starting point that might inspire you to explore deeper tools.
---
## What You're Getting
- **Dual visualization modes** — Matrix table and/or Imbalance bars
- **Activity-based color system** — Noise fades, signals pop
- **Real-time Nexural Flow Meter** — Live imbalance readings
- **Flexible configuration** — Show what you need, hide what you don't
- **Honest accuracy** — 85-90% correlation with official TradingView data
- **Clean, professional presentation** — Designed for actual trading, not screenshots
---
## What You're Not Getting
- Raw tick data (TradingView limitation)
- Bid/ask tape attribution (TradingView limitation)
- Order book depth (TradingView limitation)
- 99% accuracy (impossible on this platform)
- Magic signals (this is a tool, not a strategy)
---
## Final Thoughts
Trading is hard enough without tools that overpromise and underdeliver. I'd rather give you something that works within its limitations and be honest about those limitations than sell you a fantasy.
Nexural OrderFlow Matrix does what it says. It presents TradingView's best volume delta data in a clear, heatmap format with intelligent color coding. It's accurate within the platform's constraints. It's clean, it's fast, and it doesn't clutter your chart with noise.
Use it wisely. Combine it with price action, levels, and your own market understanding. And if you ever feel limited by what TradingView offers, know that there are deeper tools waiting for you when you're ready.
Trade well.
*— Nexural Trading*
---
## Quick Reference Card
**Built For:** Index Futures (ES, NQ, YM, RTY)
**Also Works On:** CL, GC, SPY, QQQ, large-cap stocks
**Avoid On:** Low-volume stocks, forex, illiquid instruments
**Best Timeframes:** 1-min to 15-min intraday
**Key Metric:** Delta % (not raw delta)
**Accuracy:** ~85-90% vs TradingView official tools
**Edge:** Divergences between price and delta
---
*Nexural OrderFlow Matrix — Engineered for index futures. Maximum accuracy within TradingView's limits.*

Rapid Cumulative Delta Proxy (Close vs Close)Rapid Cumulative Delta Proxy (Close vs Close)
1. Summary
This indicator provides a powerful proxy for Cumulative Delta , offering insight into the buying and selling pressure within each candle without requiring access to specialized tick data. It works by analyzing a Lower Timeframe (LTF) of your choice and accumulating the volume based on simple price changes, then displaying the results in a clean, customizable "footprint-style" table on your main chart.
This tool is designed for traders who want to understand the underlying order flow dynamics and see whether buyers or sellers were more aggressive during the formation of a candle.
2. Key Features
Cumulative Delta Proxy: Calculates delta by comparing the close of each LTF bar to the previous one, assigning volume to either buyers or sellers.
Lower Timeframe Analysis: Gives you the flexibility to choose any LTF (e.g., 1-minute, 5-minute, or even seconds) to build your delta analysis, allowing for granular or broad views.
Historical "Footprint" Table: Displays data for the current, developing bar as well as a user-defined number of previous bars, allowing for immediate historical context.
Live Data Monitoring: The top row of the table always shows the real-time, developing values for the current bar.
Full Visual Customization: Provides extensive options to control the table's position, colors, and text styles to perfectly match your chart's theme.
3. Calculation Mechanism
The logic of this indicator is straightforward and transparent. For every single bar on your main (Higher Timeframe) chart, the script performs the following steps:
Data Collection: The script uses the request.security_lower_tf() function to gather all the close and volume data from the user-specified Lower Timeframe that falls within the current HTF bar.
Volume Allocation: It then iterates through each of these LTF bars to determine if it represented buying or selling pressure.
If an LTF bar's close is greater than the close of the previous LTF bar, its entire volume is added to a running total of Buy Volume.
If an LTF bar's close is less than the close of the previous LTF bar, its volume is added to a running total of Sell Volume.
If the closes are identical, the volume is considered neutral and is ignored.
Final Calculations: Once all the LTF bars have been processed, the final metrics for that single HTF bar are calculated:
Delta: This is the net difference between the accumulated volumes. The formula is:
Delta=TotalBuyVolume−TotalSellVolume
Imbalance %: This shows the percentage dominance of buyers or sellers relative to the total activity. The formula is:
Imbalance%= Delta / (TotalBuyVolume+TotalSellVolume) ×100
This entire process repeats for each bar on your chart, with the results stored and displayed in the historical table.
4. Settings Explained
Lower Timeframe: The most important setting. This is the timeframe the script will analyze to calculate delta. It must be a lower interval than your main chart's timeframe.
History Bar Count: Controls how many previous, closed bars of data are displayed in the table below the "Live" bar.
Table Visuals (Group):
Header Colors: Customize the text color for each column header (Buy, Sell, Delta, Imbalance).
Background Colors: Set the colors used for the conditional backgrounds on the Delta and Imbalance columns (Positive, Negative, and Neutral values).
Data Text Style: Control the color and size of all standard text in the table. Placed on one line for convenience.
Table Position: A dropdown menu to place the table in any of nine positions on your chart.
5. Trading Concepts & Examples
This is where the Delta Table truly shines. By comparing the delta data (the "Effort") with the candle on your chart (the "Result"), you can gain powerful insights.
A. Effort vs. Result Analysis
This concept helps you determine if the trading activity is actually succeeding in moving the price.
Confirmation:
High positive delta on a large green candle that closes strong. This confirms the buying pressure was effective and the trend is likely to continue.
High negative delta on a large red candle that closes weak. This confirms the selling pressure was effective.
Divergence (Sign of Reversal):
Absorption: You see very high positive delta, but the candle on the chart is small, with a long upper wick (a shooting star). This is a major warning sign. It means buyers exerted massive effort, but the result was poor because a large seller absorbed all their buying, preventing the price from rising. This often precedes a move down.
Exhaustion: You see very high negative delta, but the candle is small with a long lower wick (a hammer). This means sellers tried their best to push the price down but failed. Their effort was met with strong buying pressure, signaling selling exhaustion and a potential bottom.
B. Identifying Traps (Two-Bar Analysis)
Traps occur when a breakout or breakdown fails, catching traders on the wrong side of the market. The Delta Table makes these easy to spot.
Example of a Bull Trap:
The Bait (Bar 1): A strong green candle breaks above a key resistance level. You look at the table and see a strong positive delta, convincing traders to go long.
The Trap (Bar 2): The very next candle is a powerful red candle that closes back below the resistance level. Now, check the table for this candle—you will often see an equally strong or even stronger negative delta.
Interpretation: The initial breakout buyers are now "trapped." The aggressive negative delta on the second bar confirms that sellers have taken control, and the trapped longs will be forced to sell, fueling a sharper decline.
Example of a Bear Trap:
The Bait (Bar 1): A strong red candle breaks below a key support level, showing a strong negative delta in the table. Traders are convinced to go short.
The Trap (Bar 2): The next candle is a powerful green candle closing back above support, accompanied by a very strong positive delta.
Interpretation: The breakdown has failed. Aggressive buyers have stepped in, "trapping" the short-sellers who must now buy back their positions, adding fuel to the rally.
6. Important Notes
Repainting: This indicator does not repaint. Once a bar on your main chart closes, its calculated values in the historical table are fixed and will not change. The "Live" data row updates in real-time as the current bar forms, which is the intended and expected behavior.
1-Second Timeframe: The script allows for using second-based intervals (e.g., "1S"). Please be aware that access to second-based timeframes on TradingView requires a Premium subscription. If you do not have one, please use a minute-based interval (e.g., "1").
Historic Bars: The script can accommodate large range, does not have any max bar limit. Please be aware that large table will require heavy computing power.
7. Disclaimer
The information provided by this indicator is for educational and informational purposes only and does not constitute financial advice. All trading and investment decisions are your own and should be made with the help of a qualified financial professional. Trading financial markets involves substantial risk, and past performance is not indicative of future results. The author is not responsible for any losses you may incur as a result of using this script.

Cumulative Volume Delta (SB-1) 2.0
📈 Cumulative Volume Delta (CVD) — Stair-Step + Threshold Alerts
🔍 Overview
This Cumulative Volume Delta (CVD) tool visualizes aggressive buying and selling pressure in the market by plotting candlestick-style bars based on volume delta. It helps traders understand which side — buyers or sellers — is exerting more control on lower timeframes and highlights momentum shifts through stair-step patterns and delta threshold breaks. Resets to zero at EOD
Ideal for futures traders, scalpers, and intraday strategists looking for orderflow-based confirmation.
🧠 What Is CVD?
CVD (Cumulative Volume Delta) measures the difference between market buys and sells over a specific timeframe. When the delta is rising, it suggests buyers are being more aggressive. Falling delta suggests seller dominance.
This script aggregates volume delta from a lower timeframe and plots it in a higher timeframe context, allowing you to track microstructure shifts within larger candles.
📊 Features
✅ CVD Candlesticks
Each bar represents volume delta as an OHLC-style candle using:
Open: Delta at the start of the bar
High/Low: Peak delta range
Close: Final delta value at bar close
Teal candles = Net buying pressure
Red candles = Net selling pressure
✅ Threshold Levels (Key Visual Zones)
The script includes horizontal dashed lines at:
+5,000 and +10,000 → Signify strong buying pressure
-5,000 and -10,000 → Signify strong selling pressure
0 line → Neutrality line (no net pressure)
These levels act as volume-based support/resistance zones and breakout confirmation tools. For example:
A CVD cross above +5,000 shows buyers taking control
A CVD cross above +10,000 implies strong bullish momentum
A CVD cross below -5,000 or -10,000 signals intense selling pressure
📈 Stair-Step Pattern Detection
Detects two specific volume-based continuation setups:
Bullish Stair-Step: Both the high and low of the CVD candle are higher than the previous candle
Bearish Stair-Step: Both the high and low of the CVD candle are lower than the previous candle
These patterns often appear during trending moves and serve as confirmation of strength or continuation.
Visual markers:
🟢 Green triangles below bars = Bullish stair-step
🔴 Red triangles above bars = Bearish stair-step
🔔 Alert Conditions
Get real-time alerts when:
Bullish Stair-Step is detected
Bearish Stair-Step is detected
CVD crosses above +5,000
CVD crosses below -5,000
📢 Alerts only trigger on crossover, not every time CVD remains above or below. This avoids repetitive notifications.
⚙️ Inputs & Customization
Anchor Timeframe: The higher timeframe to which CVD data is applied (default: 1D)
Lower Timeframe: The timeframe used to calculate the CVD delta (default: 5 minutes)
Optional Override: Use custom timeframe toggle to force your own micro timeframe
📌 How to Use This CVD Indicator (Step-by-Step Guide)
✅ 1. Confirm Bias Using the Zero Line
The zero line (0 CVD) represents neutral pressure — neither buyers nor sellers are dominating.
Use it as your first filter:
🔼 If CVD is above 0 and rising → Buyer control
🔽 If CVD is below 0 and falling → Seller control
🧠 Tip: CVD rising while price is consolidating may signal hidden buyer interest.
✅ 2. Watch for Crosses of Key Levels: +5,000 and +10,000
These levels act as momentum thresholds:
Level Signal Type What It Means
+5,000 Buyer breakout Buyers are starting to dominate
+10,000 Strong bull bias Strong institutional or algorithmic buying flow
-5,000 Seller breakout Sellers are taking control
-10,000 Strong bear bias Heavy selling pressure is entering the market
Wait for CVD to cross above +5K or below -5K to confirm the active side.
Use these crossovers as entry triggers, breakout confirmations, or trade filters.
🔔 Alerts fire only when the level is first crossed, not every bar above/below.
✅ 3. Use Stair-Step Patterns for Continuation Confirmation
The indicator shows stair-step patterns using triangle signals:
🟢 Green triangle below bar = Bullish stair-step
Suggests a higher high and higher low in delta → buyers stepping up
🔴 Red triangle above bar = Bearish stair-step
Suggests lower highs and lower lows in delta → selling pressure building
Use stair-step signals:
To confirm a continuation of trend
As an entry or add-on signal
Especially after a threshold breakout
🧠 Example: If CVD breaks above +5K and forms bullish stairs → confirms strong trend, ideal for momentum entries.
✅ 4. Combine with Price Action or Structure
CVD works best when used with price, not in isolation. For example:
📉 Price makes a new low but CVD doesn’t → potential bullish divergence
📈 CVD surges while price lags → buyers are absorbing, breakout likely
Use it with:
VWAP
Orderblocks
Liquidity sweeps
Break of market structure/MSS/BOS
✅ 5.
Set Anchor Timeframe = Daily
Set Lower Timeframe = 5 minutes (default)
This lets you:
See intraday flow inside daily bars
Confirm whether a daily candle is being built on net buying or selling
🧠 You’re essentially seeing intra-bar aggression within a bigger time structure.
🧭 Example Trading Setup
Bullish Scenario:
CVD is rising and above 0
CVD crosses above +5,000 → alert fires
Green stair-step appears
Price breaks local resistance or liquidity sweep completes
✅ Consider long entry with structure and CVD alignment
🎯 Place stops below last stair-step or structural low
📌 Final Notes
This tool does not repaint and is designed to work in real-time across all futures, crypto, and equity instruments that support volume data. If your symbol does not provide volume, the script will notify you.
Use it in confluence with VWAP, liquidity zones, or structure breaks for high-confidence trades.

ZN Market CycleDescription
The purpose of this indicator is to create symbols that try to show the most accurate positions possible for trading. The formation of BUY/SELL symbols is based on the intersection of RSI, MACD and 6 bar moving average. Additionally, BOLLINGER bands were used to determine the lower and upper points. For example, while the price is falling, it will create an BOTTOM symbol when the price crosses the lower BOLLINGER band upwards. If this transition is accompanied by the RSI breaking its average upwards, it will produce the STRONG BOTTOM symbol. If the RSI average crosses the RSIMA direction upwards, it will produce the DEEP symbol. Of course, the scenario described above is also valid in the opposite direction. The purpose of the icons on the screen is indicated by the text above them. However, a detailed explanation of what these symbols do is given below.
Symbols
The symbols are explained one by one below.
BOTTOM: Indicates that the fall has slowed down or may have been completed.
STRONG BOTTOM: Indicates that the fall has stopped or may have been completed.
TOP: Indicates that the ascent has slowed down or may have been completed.
STRONG TOP: Indicates that the ascent has stopped or may have been completed.
BUY: Indicates the convenient location to make a buying. Buying pressure may increase after this symbol.
STRONG BUY: Indicates the most suitable location for buying. It should be considered that a strong buying wave may come after the appearance of this symbol.
SELL: Indicates the appropriate location to selling Selling pressure may increase after this symbol.
STRONG SELL: Indicates the most suitable position to selling. It should be considered that a strong selling wave may come after the appearance of this symbol.
PEAK: It indicates that the uptrend has come to an end.
DEEP: It indicates that the downtrend has come to an end.
ARROWS: Arrows show the trend direction. Since it varies a lot, it should be used to follow the trend rather than buy/sell. However, the appearance of a downward arrow shortly after a buy signal should suggest that the buy signal is fake. In this case, the buying position can be closed. This also applies to the selling process.
Best Use
This indicator should be used for SPOT trades. Regardless, since it is not possible to know exactly the direction of the market, it should be considered to buy gradually at buy signals and sell gradually at sell signals.
It should be followed for at least a 4-hour period. We do not recommend its use as the margin of error will increase in shorter time periods.
After a buy signal comes, a short decline may occur and the rise may begin. An immediate rise should not be expected after the signal arrives. Since the signals are not guaranteed to work 100%, we do not recommend you to trade with all your money.
No Repainting
Repainting is definitely not done. After the symbols appear, the closing should be expected. Once the closing occurs, the symbol will now be permanent.
Disclaimer
This indicator is for informational purposes only and should be used for educational purposes only. You may lose money if you rely on this to trade without additional information. Use at your own risk.
Version
v1.0

Directional Movement Index + Fisher Price Action With LabelsDIRECTIONAL MOVEMENT INDEX + FISHER PRICE ACTION WITH LABELS
Directional Movement Index shows buy and sell pressure.
Fisher transform shows price action trending bullish or bearish.
Caution dots notify you of conflicting trends.
***HOW TO USE***
The top lines are the fisher transform showing you the price action trend.
The bottom lines filled with color shows the DMI directional movement index.
The yellow dots at the bottom tell you if these two indicators are currently giving conflicting signals.
DMI
If the green line is above the red line and the background is colored green, there is more market buying than selling.
If the red line is above the green line and the background is colored red, there is more market selling than buying.
FISHER TRANSFORM
If the lines are painted green, the price action is trending up.
If the lines are painted red, the price action is trending down.
CAUTION DOTS
If a yellow dot shows up at the bottom of the chart, it is notifying you that the DMI and Fisher Transform are currently giving opposite signals…. so use caution.
***BULLISH/BEARISH LABEL***
There is also a label on the right side that tells you whether there is more buying or selling. This table updates in real time and changes colors so you can get an easy, quick interpretation of the current buy/sell pressure without having to look at the indicator data so you can make faster decisions on whether to enter or exit a trade.
Green means more market buying than selling.
Red means more market selling than buying.
Blue means an equal amount of market buying and selling.
If buying pressure is bullish but below the 20 level, a second label will show up in purple letting you know there is weak buying pressure so use caution.
If selling pressure is bearish but below the 20 level, a second label will show up in purple letting you know there is weak selling pressure so use caution.
There is a third label showing the current trend of the fisher transform. Green means bullish price action. Red means bearish price action.
The fourth label is orange and only shows up when the DMI and Fisher Transform are currently giving opposite signals, so make sure you use caution during those times.
***MARKETS***
This indicator can be used as a signal on all markets, including stocks, crypto, futures and forex.
***TIMEFRAMES***
This directional movement index + fisher transform indicator can be used on all timeframes.
***TIPS***
Try using numerous indicators of ours on your chart so you can instantly see the bullish or bearish trend of multiple indicators in real time without having to analyze the data. Some of our favorites are our Auto Fibonacci, Volume Profile, Momentum, Auto Support And Resistance and Money Flow Index in combination with this Directional Movement Index + Fisher Transform. They all have real time Bullish and Bearish labels as well so you can immediately understand each indicator's trend.

Nexural DI Pressure ImbalanceNexural DI Pressure Imbalance
Overview
This indicator combines traditional Directional Index (DI) analysis with modern order flow concepts to help you identify buying and selling pressure in the market. I built this because I wanted something that goes beyond basic DI calculations and actually shows what's happening inside each candle.
What Makes This Different
Instead of just looking at directional movement, this indicator analyzes:
Candle-by-candle pressure - Where did the price actually close within the candle's range? This tells us who won the battle between buyers and sellers.
Volume-weighted calculations - Low volume moves get less weight, because they're less reliable.
Order flow approximation - Estimates buying versus selling volume based on price action and where the close ended up.
Cumulative delta - Tracks the running total of buy/sell imbalance over your chosen period.
How to Read It
The main display shows two lines:
DI+ (green) - Buying pressure
DI- (red) - Selling pressure
When DI+ is above DI-, buyers are in control. When DI- is on top, sellers have the edge.
The volume bars at the bottom change color based on whether the candle was bought or sold, with brighter colors indicating stronger order flow.
The candle imbalance histogram (middle section) shows you the internal pressure within each candle. Positive values mean the close was near the high, negative means it closed near the low.
The purple cumulative delta line tracks the overall buying/selling imbalance over time. When it's rising, there's more buying volume. When falling, more selling.
Info Table
The table in the top-right gives you a quick summary:
State - Current market condition (Strong Buy, Bullish, Bearish, Strong Sell)
DI Pressure - Net directional pressure
Candle Imb - Current candle imbalance score
Delta - Cumulative volume delta
Composite - Combined score from all components
Volume - Current volume level (Low, Normal, High, Extreme, Strong)
Flow - Order flow strength (Weak, Moderate, Strong)
Settings You Can Adjust
Core Settings:
DI Length - How many periods to use for DI calculation (default 14)
Volume Weighting - Whether to reduce the impact of low volume bars
ATR Normalization - Scales the indicator to match current volatility
Low Volume Threshold - What counts as "low volume" (default 0.3 = 30% of average)
Candle Analysis:
Imbalance Smoothing - How much to smooth the candle imbalance line
Delta Lookback Period - How far back to track cumulative delta
Order Flow:
Flow Sensitivity - Higher values = stricter requirements for "strong flow" signals
Visual:
Toggle various display elements on/off to clean up your chart
Alerts
The indicator includes several alert conditions:
Strong buy/sell signals (DI crossovers with strong volume)
Candle imbalance flips (pressure shifts)
Extreme pressure conditions (composite score above 70 or below -70)
Divergences between price and indicator
Strong order flow detection
Best Use Cases
This works well for:
Confirming trend strength
Identifying potential reversals when price and pressure diverge
Spotting low-conviction moves (weak volume plus conflicting signals)
Finding high-probability entries when all components align
A Few Notes
Low volume periods get a gray background warning - be careful with signals during these times
The indicator combines multiple analysis methods, so you're getting a more complete picture than any single metric alone
Extreme readings (bright green/red backgrounds) often precede reversals or consolidation
Works on any timeframe, though I find it most useful on 5-minute charts and up
This is not a magic bullet, but it does help you see what's actually happening beneath price action. Use it alongside your other analysis tools and always manage your risk.